

book1
book1
book1

You also want an ePaper? Increase the reach of your titles
YUMPU automatically turns print PDFs into web optimized ePapers that Google loves.
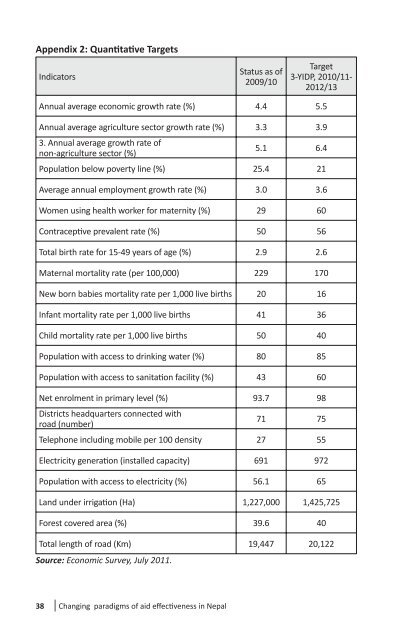
Appendix 2: Quan� ta� ve Targets<br />
Indicators<br />
38<br />
Changing paradigms of aid eff ec� veness in Nepal<br />
Status as of<br />
2009/10<br />
Target<br />
3-YIDP, 2010/11-<br />
2012/13<br />
Annual average economic growth rate (%) 4.4 5.5<br />
Annual average agriculture sector growth rate (%) 3.3 3.9<br />
3. Annual average growth rate of<br />
non-agriculture sector (%)<br />
5.1 6.4<br />
Popula� on below poverty line (%) 25.4 21<br />
Average annual employment growth rate (%) 3.0 3.6<br />
Women using health worker for maternity (%) 29 60<br />
Contracep� ve prevalent rate (%) 50 56<br />
Total birth rate for 15-49 years of age (%) 2.9 2.6<br />
Maternal mortality rate (per 100,000) 229 170<br />
New born babies mortality rate per 1,000 live births 20 16<br />
Infant mortality rate per 1,000 live births 41 36<br />
Child mortality rate per 1,000 live births 50 40<br />
Popula� on with access to drinking water (%) 80 85<br />
Popula� on with access to sanita� on facility (%) 43 60<br />
Net enrolment in primary level (%) 93.7 98<br />
Districts headquarters connected with<br />
road (number)<br />
71 75<br />
Telephone including mobile per 100 density 27 55<br />
Electricity genera� on (installed capacity) 691 972<br />
Popula� on with access to electricity (%) 56.1 65<br />
Land under irriga� on (Ha) 1,227,000 1,425,725<br />
Forest covered area (%) 39.6 40<br />
Total length of road (Km)<br />
Source: Economic Survey, July 2011.<br />
19,447 20,122