Windows QTL Cartographer 2.5 - FTP Directory Listing
Windows QTL Cartographer 2.5 - FTP Directory Listing
Windows QTL Cartographer 2.5 - FTP Directory Listing

You also want an ePaper? Increase the reach of your titles
YUMPU automatically turns print PDFs into web optimized ePapers that Google loves.
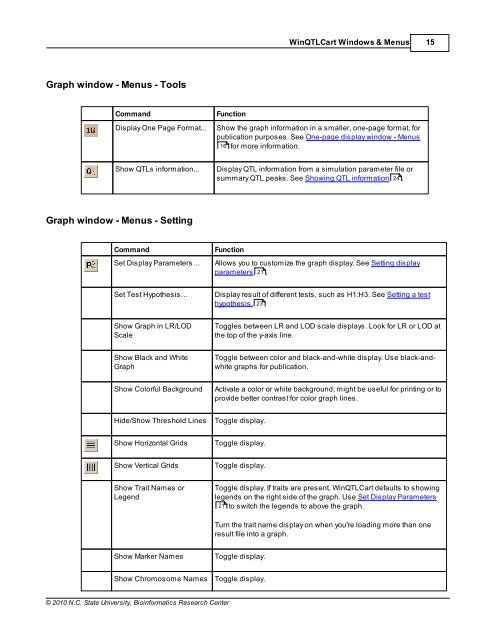
Graph window - Menus - Tools<br />
Command Function<br />
© 2010 N.C. State University, Bioinformatics Research Center<br />
Win<strong>QTL</strong>Cart <strong>Windows</strong> & Menus 15<br />
Display One Page Format... Show the graph information in a smaller, one-page format, for<br />
publication purposes. See One-page display window - Menus<br />
16 for more information.<br />
Show <strong>QTL</strong>s information... Display <strong>QTL</strong> information from a simulation parameter file or<br />
summary <strong>QTL</strong> peaks. See Showing <strong>QTL</strong> information 24 .<br />
Graph window - Menus - Setting<br />
Command Function<br />
Set Display Parameters… Allows you to customize the graph display. See Setting display<br />
parameters 21 .<br />
Set Test Hypothesis… Display result of different tests, such as H1:H3. See Setting a test<br />
hypothesis. 23<br />
Show Graph in LR/LOD<br />
Scale<br />
Show Black and White<br />
Graph<br />
Toggles between LR and LOD scale displays. Look for LR or LOD at<br />
the top of the y-axis line.<br />
Toggle between color and black-and-white display. Use black-andwhite<br />
graphs for publication.<br />
Show Colorful Background Activate a color or white background; might be useful for printing or to<br />
provide better contrast for color graph lines.<br />
Hide/Show Threshold Lines Toggle display.<br />
Show Horizontal Grids Toggle display.<br />
Show Vertical Grids Toggle display.<br />
Show Trait Names or<br />
Legend<br />
Show Marker Names Toggle display.<br />
Show Chromosome Names Toggle display.<br />
Toggle display. If traits are present, Win<strong>QTL</strong>Cart defaults to showing<br />
legends on the right side of the graph. Use Set Display Parameters<br />
21<br />
to switch the legends to above the graph.<br />
Turn the trait name display on when you're loading more than one<br />
result file into a graph.