Windows QTL Cartographer 2.5 - FTP Directory Listing
Windows QTL Cartographer 2.5 - FTP Directory Listing
Windows QTL Cartographer 2.5 - FTP Directory Listing

You also want an ePaper? Increase the reach of your titles
YUMPU automatically turns print PDFs into web optimized ePapers that Google loves.
24<br />
<strong>Windows</strong> <strong>QTL</strong> <strong>Cartographer</strong> <strong>2.5</strong><br />
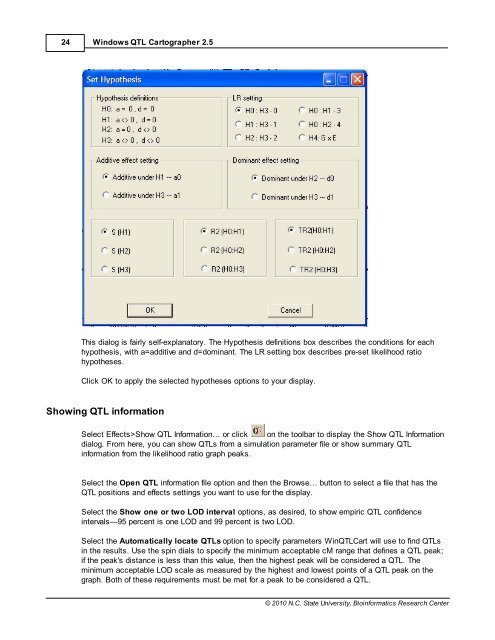
This dialog is fairly self-explanatory. The Hypothesis definitions box describes the conditions for each<br />
hypothesis, with a=additive and d=dominant. The LR setting box describes pre-set likelihood ratio<br />
hypotheses.<br />
Click OK to apply the selected hypotheses options to your display.<br />
Showing <strong>QTL</strong> information<br />
Select Effects>Show <strong>QTL</strong> Information… or click on the toolbar to display the Show <strong>QTL</strong> Information<br />
dialog. From here, you can show <strong>QTL</strong>s from a simulation parameter file or show summary <strong>QTL</strong><br />
information from the likelihood ratio graph peaks.<br />
Select the Open <strong>QTL</strong> information file option and then the Browse… button to select a file that has the<br />
<strong>QTL</strong> positions and effects settings you want to use for the display.<br />
Select the Show one or two LOD interval options, as desired, to show empiric <strong>QTL</strong> confidence<br />
intervals—95 percent is one LOD and 99 percent is two LOD.<br />
Select the Automatically locate <strong>QTL</strong>s option to specify parameters Win<strong>QTL</strong>Cart will use to find <strong>QTL</strong>s<br />
in the results. Use the spin dials to specify the minimum acceptable cM range that defines a <strong>QTL</strong> peak;<br />
if the peak's distance is less than this value, then the highest peak will be considered a <strong>QTL</strong>. The<br />
minimum acceptable LOD scale as measured by the highest and lowest points of a <strong>QTL</strong> peak on the<br />
graph. Both of these requirements must be met for a peak to be considered a <strong>QTL</strong>.<br />
© 2010 N.C. State University, Bioinformatics Research Center