Windows QTL Cartographer 2.5 - FTP Directory Listing
Windows QTL Cartographer 2.5 - FTP Directory Listing
Windows QTL Cartographer 2.5 - FTP Directory Listing
Create successful ePaper yourself
Turn your PDF publications into a flip-book with our unique Google optimized e-Paper software.
60<br />
<strong>Windows</strong> <strong>QTL</strong> <strong>Cartographer</strong> <strong>2.5</strong><br />
Create a <strong>QTL</strong> mapping result file (*.QRT) and open it in the Graph window<br />
Create a <strong>QTL</strong> summary information file using the E<strong>QTL</strong> function.<br />
Display a confirmation box asking if you want to display <strong>QTL</strong> summary information in the Main<br />
window's Data pane.<br />
Composite Interval Mapping<br />
What it is<br />
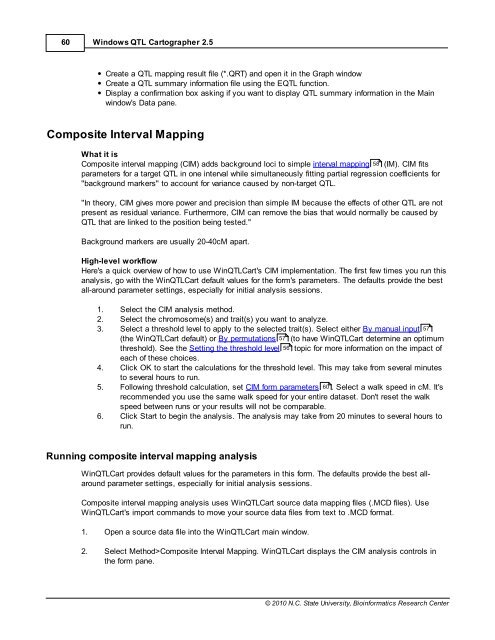
Composite interval mapping (CIM) adds background loci to simple interval mapping 58 (IM). CIM fits<br />
parameters for a target <strong>QTL</strong> in one interval while simultaneously fitting partial regression coefficients for<br />
"background markers" to account for variance caused by non-target <strong>QTL</strong>.<br />
"In theory, CIM gives more power and precision than simple IM because the effects of other <strong>QTL</strong> are not<br />
present as residual variance. Furthermore, CIM can remove the bias that would normally be caused by<br />
<strong>QTL</strong> that are linked to the position being tested."<br />
Background markers are usually 20-40cM apart.<br />
High-level workflow<br />
Here's a quick overview of how to use Win<strong>QTL</strong>Cart's CIM implementation. The first few times you run this<br />
analysis, go with the Win<strong>QTL</strong>Cart default values for the form's parameters. The defaults provide the best<br />
all-around parameter settings, especially for initial analysis sessions.<br />
1. Select the CIM analysis method.<br />
2. Select the chromosome(s) and trait(s) you want to analyze.<br />
3. Select a threshold level to apply to the selected trait(s). Select either By manual input 57<br />
(the Win<strong>QTL</strong>Cart default) or By permutations 57 (to have Win<strong>QTL</strong>Cart determine an optimum<br />
threshold). See the Setting the threshold level 56 topic for more information on the impact of<br />
each of these choices.<br />
4. Click OK to start the calculations for the threshold level. This may take from several minutes<br />
to several hours to run.<br />
5. Following threshold calculation, set CIM form parameters 60<br />
. Select a walk speed in cM. It's<br />
recommended you use the same walk speed for your entire dataset. Don't reset the walk<br />
speed between runs or your results will not be comparable.<br />
6. Click Start to begin the analysis. The analysis may take from 20 minutes to several hours to<br />
run.<br />
Running composite interval mapping analysis<br />
Win<strong>QTL</strong>Cart provides default values for the parameters in this form. The defaults provide the best allaround<br />
parameter settings, especially for initial analysis sessions.<br />
Composite interval mapping analysis uses Win<strong>QTL</strong>Cart source data mapping files (.MCD files). Use<br />
Win<strong>QTL</strong>Cart's import commands to move your source data files from text to .MCD format.<br />
1. Open a source data file into the Win<strong>QTL</strong>Cart main window.<br />
2. Select Method>Composite Interval Mapping. Win<strong>QTL</strong>Cart displays the CIM analysis controls in<br />
the form pane.<br />
© 2010 N.C. State University, Bioinformatics Research Center


