Windows QTL Cartographer 2.5 - FTP Directory Listing
Windows QTL Cartographer 2.5 - FTP Directory Listing
Windows QTL Cartographer 2.5 - FTP Directory Listing

You also want an ePaper? Increase the reach of your titles
YUMPU automatically turns print PDFs into web optimized ePapers that Google loves.
68<br />
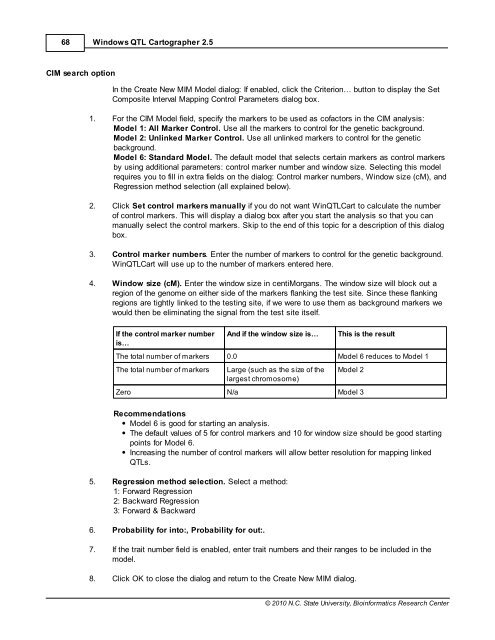
CIM search option<br />
<strong>Windows</strong> <strong>QTL</strong> <strong>Cartographer</strong> <strong>2.5</strong><br />
In the Create New MIM Model dialog: If enabled, click the Criterion… button to display the Set<br />
Composite Interval Mapping Control Parameters dialog box.<br />
1. For the CIM Model field, specify the markers to be used as cofactors in the CIM analysis:<br />
Model 1: All Marker Control. Use all the markers to control for the genetic background.<br />
Model 2: Unlinked Marker Control. Use all unlinked markers to control for the genetic<br />
background.<br />
Model 6: Standard Model. The default model that selects certain markers as control markers<br />
by using additional parameters: control marker number and window size. Selecting this model<br />
requires you to fill in extra fields on the dialog: Control marker numbers, Window size (cM), and<br />
Regression method selection (all explained below).<br />
2. Click Set control markers manually if you do not want Win<strong>QTL</strong>Cart to calculate the number<br />
of control markers. This will display a dialog box after you start the analysis so that you can<br />
manually select the control markers. Skip to the end of this topic for a description of this dialog<br />
box.<br />
3. Control marker numbers. Enter the number of markers to control for the genetic background.<br />
Win<strong>QTL</strong>Cart will use up to the number of markers entered here.<br />
4. Window size (cM). Enter the window size in centiMorgans. The window size will block out a<br />
region of the genome on either side of the markers flanking the test site. Since these flanking<br />
regions are tightly linked to the testing site, if we were to use them as background markers we<br />
would then be eliminating the signal from the test site itself.<br />
If the control marker number<br />
is…<br />
And if the window size is… This is the result<br />
The total number of markers 0.0 Model 6 reduces to Model 1<br />
The total number of markers Large (such as the size of the<br />
largest chromosome)<br />
Model 2<br />
Zero N/a Model 3<br />
Recommendations<br />
Model 6 is good for starting an analysis.<br />
The default values of 5 for control markers and 10 for window size should be good starting<br />
points for Model 6.<br />
Increasing the number of control markers will allow better resolution for mapping linked<br />
<strong>QTL</strong>s.<br />
5. Regression method selection. Select a method:<br />
1: Forward Regression<br />
2: Backward Regression<br />
3: Forward & Backward<br />
6. Probability for into:, Probability for out:.<br />
7. If the trait number field is enabled, enter trait numbers and their ranges to be included in the<br />
model.<br />
8. Click OK to close the dialog and return to the Create New MIM dialog.<br />
© 2010 N.C. State University, Bioinformatics Research Center