Windows QTL Cartographer 2.5 - FTP Directory Listing
Windows QTL Cartographer 2.5 - FTP Directory Listing
Windows QTL Cartographer 2.5 - FTP Directory Listing

Create successful ePaper yourself
Turn your PDF publications into a flip-book with our unique Google optimized e-Paper software.
80<br />
<strong>Windows</strong> <strong>QTL</strong> <strong>Cartographer</strong> <strong>2.5</strong><br />
Setting menu<br />
Command Function<br />
Select Chromosomes… Select the chromosomes you want displayed in the graphic.<br />
Show Chromosome Name Toggle between showing the chromosome name or its label<br />
Font Size >> Increase font size for graph<br />
Font Size > Increase the space between markers (graph gets longer)<br />
Space Between > Go to the next chromosome in the series<br />
Chromosome Name> Increase number of graphics displayed in a column<br />
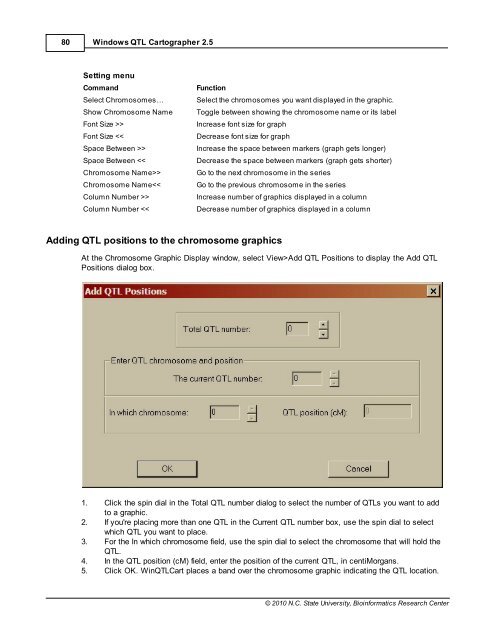
Column Number Add <strong>QTL</strong> Positions to display the Add <strong>QTL</strong><br />
Positions dialog box.<br />
1. Click the spin dial in the Total <strong>QTL</strong> number dialog to select the number of <strong>QTL</strong>s you want to add<br />
to a graphic.<br />
2. If you're placing more than one <strong>QTL</strong> in the Current <strong>QTL</strong> number box, use the spin dial to select<br />
which <strong>QTL</strong> you want to place.<br />
3. For the In which chromosome field, use the spin dial to select the chromosome that will hold the<br />
<strong>QTL</strong>.<br />
4. In the <strong>QTL</strong> position (cM) field, enter the position of the current <strong>QTL</strong>, in centiMorgans.<br />
5. Click OK. Win<strong>QTL</strong>Cart places a band over the chromosome graphic indicating the <strong>QTL</strong> location.<br />
© 2010 N.C. State University, Bioinformatics Research Center