Windows QTL Cartographer 2.5 - FTP Directory Listing
Windows QTL Cartographer 2.5 - FTP Directory Listing
Windows QTL Cartographer 2.5 - FTP Directory Listing

Create successful ePaper yourself
Turn your PDF publications into a flip-book with our unique Google optimized e-Paper software.
62<br />
<strong>Windows</strong> <strong>QTL</strong> <strong>Cartographer</strong> <strong>2.5</strong><br />
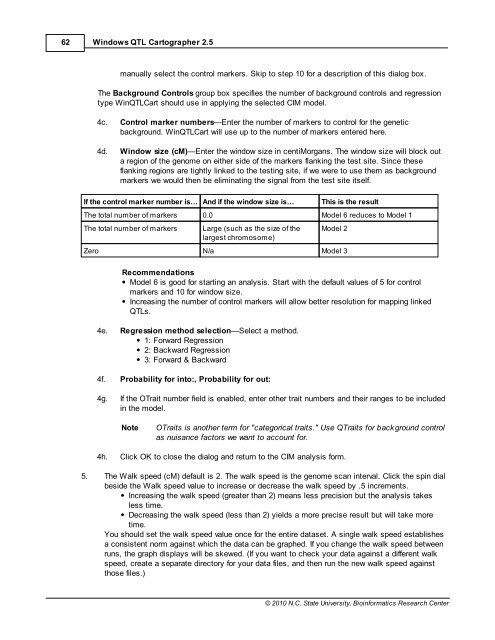
manually select the control markers. Skip to step 10 for a description of this dialog box.<br />
The Background Controls group box specifies the number of background controls and regression<br />
type Win<strong>QTL</strong>Cart should use in applying the selected CIM model.<br />
4c. Control marker numbers—Enter the number of markers to control for the genetic<br />
background. Win<strong>QTL</strong>Cart will use up to the number of markers entered here.<br />
4d. Window size (cM)—Enter the window size in centiMorgans. The window size will block out<br />
a region of the genome on either side of the markers flanking the test site. Since these<br />
flanking regions are tightly linked to the testing site, if we were to use them as background<br />
markers we would then be eliminating the signal from the test site itself.<br />
If the control marker number is… And if the window size is… This is the result<br />
The total number of markers 0.0 Model 6 reduces to Model 1<br />
The total number of markers Large (such as the size of the<br />
largest chromosome)<br />
Model 2<br />
Zero N/a Model 3<br />
Recommendations<br />
Model 6 is good for starting an analysis. Start with the default values of 5 for control<br />
markers and 10 for window size.<br />
Increasing the number of control markers will allow better resolution for mapping linked<br />
<strong>QTL</strong>s.<br />
4e. Regression method selection—Select a method.<br />
1: Forward Regression<br />
2: Backward Regression<br />
3: Forward & Backward<br />
4f. Probability for into:, Probability for out:<br />
4g. If the OTrait number field is enabled, enter other trait numbers and their ranges to be included<br />
in the model.<br />
Note OTraits is another term for "categorical traits." Use QTraits for background control<br />
as nuisance factors we want to account for.<br />
4h. Click OK to close the dialog and return to the CIM analysis form.<br />
5. The Walk speed (cM) default is 2. The walk speed is the genome scan interval. Click the spin dial<br />
beside the Walk speed value to increase or decrease the walk speed by .5 increments.<br />
Increasing the walk speed (greater than 2) means less precision but the analysis takes<br />
less time.<br />
Decreasing the walk speed (less than 2) yields a more precise result but will take more<br />
time.<br />
You should set the walk speed value once for the entire dataset. A single walk speed establishes<br />
a consistent norm against which the data can be graphed. If you change the walk speed between<br />
runs, the graph displays will be skewed. (If you want to check your data against a different walk<br />
speed, create a separate directory for your data files, and then run the new walk speed against<br />
those files.)<br />
© 2010 N.C. State University, Bioinformatics Research Center