Windows QTL Cartographer 2.5 - FTP Directory Listing
Windows QTL Cartographer 2.5 - FTP Directory Listing
Windows QTL Cartographer 2.5 - FTP Directory Listing

You also want an ePaper? Increase the reach of your titles
YUMPU automatically turns print PDFs into web optimized ePapers that Google loves.
© 2010 N.C. State University, Bioinformatics Research Center<br />
Win<strong>QTL</strong>Cart Procedures 59<br />
Interval mapping analysis uses Win<strong>QTL</strong>Cart mapping source data files (.MCD files). Use Win<strong>QTL</strong>Cart's<br />
import commands to move your source data files from text to .MCD format.<br />
1. Open a source data file into the Win<strong>QTL</strong>Cart main window.<br />
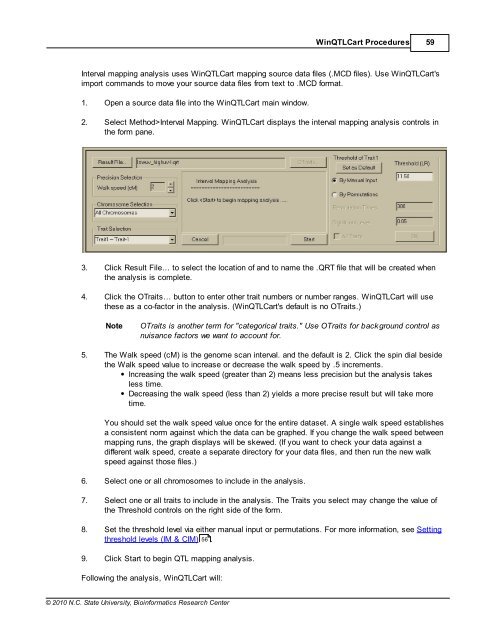
2. Select Method>Interval Mapping. Win<strong>QTL</strong>Cart displays the interval mapping analysis controls in<br />
the form pane.<br />
3. Click Result File… to select the location of and to name the .QRT file that will be created when<br />
the analysis is complete.<br />
4. Click the OTraits… button to enter other trait numbers or number ranges. Win<strong>QTL</strong>Cart will use<br />
these as a co-factor in the analysis. (Win<strong>QTL</strong>Cart's default is no OTraits.)<br />
Note OTraits is another term for "categorical traits." Use OTraits for background control as<br />
nuisance factors we want to account for.<br />
5. The Walk speed (cM) is the genome scan interval. and the default is 2. Click the spin dial beside<br />
the Walk speed value to increase or decrease the walk speed by .5 increments.<br />
Increasing the walk speed (greater than 2) means less precision but the analysis takes<br />
less time.<br />
Decreasing the walk speed (less than 2) yields a more precise result but will take more<br />
time.<br />
You should set the walk speed value once for the entire dataset. A single walk speed establishes<br />
a consistent norm against which the data can be graphed. If you change the walk speed between<br />
mapping runs, the graph displays will be skewed. (If you want to check your data against a<br />
different walk speed, create a separate directory for your data files, and then run the new walk<br />
speed against those files.)<br />
6. Select one or all chromosomes to include in the analysis.<br />
7. Select one or all traits to include in the analysis. The Traits you select may change the value of<br />
the Threshold controls on the right side of the form.<br />
8. Set the threshold level via either manual input or permutations. For more information, see Setting<br />
threshold levels (IM & CIM) 56<br />
.<br />
9. Click Start to begin <strong>QTL</strong> mapping analysis.<br />
Following the analysis, Win<strong>QTL</strong>Cart will: