Windows QTL Cartographer 2.5 - FTP Directory Listing
Windows QTL Cartographer 2.5 - FTP Directory Listing
Windows QTL Cartographer 2.5 - FTP Directory Listing

Create successful ePaper yourself
Turn your PDF publications into a flip-book with our unique Google optimized e-Paper software.
© 2010 N.C. State University, Bioinformatics Research Center<br />
Win<strong>QTL</strong>Cart Procedures 77<br />
instructions for installation and run R.<br />
3. While connected to the Internet, select R's Packages menu and select Install packages from<br />
Bioconductor.<br />
4. Scroll down to the "bim" package and click on it.<br />
5. Use the R Help to get HTML Help.<br />
6. Select Packages and click BIM from the list. There is an overview document but the options<br />
are explained in detail in bmapqtl.options.<br />
Note Pre-1.9.0 releases of R can get the bmapqtl package from the CRAN website cited above.<br />
Bioconductor is a companion project to CRAN focused on biological applications. Brian<br />
A quick summary of BIM implementation in a previous version of <strong>QTL</strong> <strong>Cartographer</strong> can be found at<br />
http://www.cs.wisc.edu/~yandell/qtl/software/Bmapqtl/Bmapqtl.pdf.<br />
High-level workflow<br />
The first few times you run this analysis, go with the Win<strong>QTL</strong>Cart default values for the form's<br />
parameters. The defaults provide the best all-around parameter settings, especially for initial analysis<br />
sessions.<br />
1. Select the BIM analysis method.<br />
2. Select the chromosome(s) and trait(s) you want to analyze.<br />
3. Click New Seed to select a new random seed.<br />
4. Click Parameters… and set the BIM parameters of interest to you.<br />
5. Click Start to begin the analysis.<br />
Running Bayesian interval mapping analysis<br />
1. Open a source data file into the Win<strong>QTL</strong>Cart main window.<br />
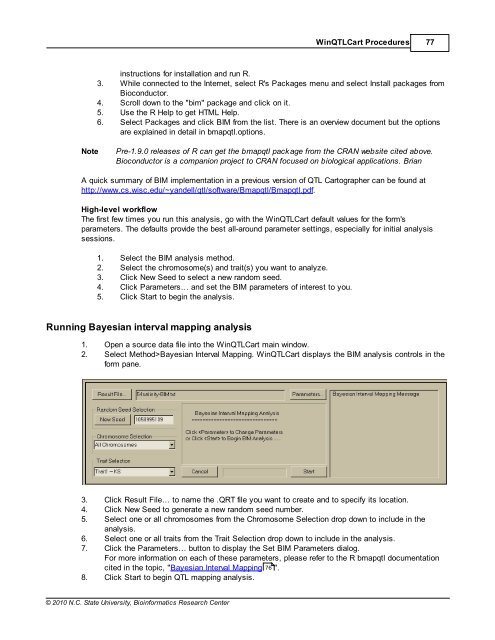
2. Select Method>Bayesian Interval Mapping. Win<strong>QTL</strong>Cart displays the BIM analysis controls in the<br />
form pane.<br />
3. Click Result File… to name the .QRT file you want to create and to specify its location.<br />
4. Click New Seed to generate a new random seed number.<br />
5. Select one or all chromosomes from the Chromosome Selection drop down to include in the<br />
analysis.<br />
6. Select one or all traits from the Trait Selection drop down to include in the analysis.<br />
7. Click the Parameters… button to display the Set BIM Parameters dialog.<br />
For more information on each of these parameters, please refer to the R bmapqtl documentation<br />
cited in the topic, "Bayesian Interval Mapping 76<br />
".<br />
8. Click Start to begin <strong>QTL</strong> mapping analysis.