Windows QTL Cartographer 2.5 - FTP Directory Listing
Windows QTL Cartographer 2.5 - FTP Directory Listing
Windows QTL Cartographer 2.5 - FTP Directory Listing

Create successful ePaper yourself
Turn your PDF publications into a flip-book with our unique Google optimized e-Paper software.
© 2010 N.C. State University, Bioinformatics Research Center<br />
Win<strong>QTL</strong>Cart Procedures 55<br />
directory is selected as the default. (Click the X in the dialog's upper right corner to close without<br />
saving.)<br />
Click Load to load a .QSI file to this window. The file's values replace the values you see in the<br />
current window.<br />
Click Adjustment to adjust values for the entire genome.<br />
Click OK to produce the simulation data file. You can then use that file for analysis.<br />
Related topics<br />
Showing <strong>QTL</strong> information<br />
Single-marker analysis<br />
24<br />
When to use<br />
For quick scanning of the entire genome (all chromosomes) to find best possible <strong>QTL</strong>s and identify<br />
missing (or incorrectly formatted) data. Use single-marker analysis first to ensure your data file is clean;<br />
then move on more sophisticated analysis methods, such as Interval Mapping 58 and Composite Interval<br />
Mapping 60<br />
.<br />
How it works<br />
Single-marker analysis is based on the idea that if there is an association between a marker genotype<br />
and trait value, it is likely that a <strong>QTL</strong> is close to that marker locus.<br />
Comments<br />
Single-marker analysis can be somewhat useful for a quick look at data, but it has been superceded by<br />
Interval Mapping and Composite Interval Mapping. IM and CIM are more thorough and accurate indicators<br />
of <strong>QTL</strong>. The prime value of Win<strong>QTL</strong>Cart's single-marker analysis is its identification of missing data that<br />
could affect later analysis.<br />
Running a single-marker analysis<br />
1. Open a mapping source data file (an .MCD file) into the Win<strong>QTL</strong>Cart main window.<br />
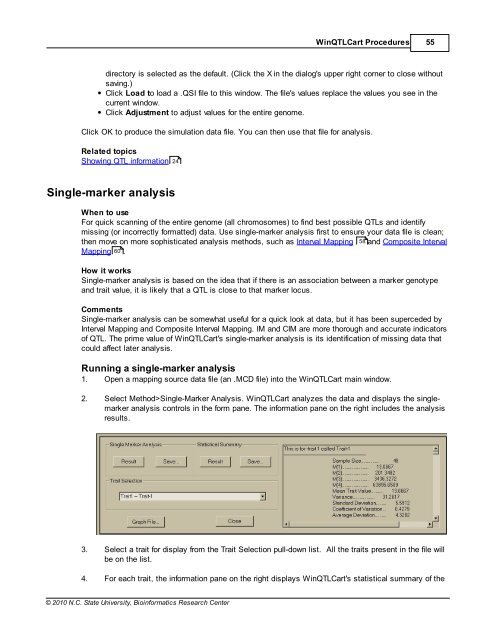
2. Select Method>Single-Marker Analysis. Win<strong>QTL</strong>Cart analyzes the data and displays the singlemarker<br />
analysis controls in the form pane. The information pane on the right includes the analysis<br />
results.<br />
3. Select a trait for display from the Trait Selection pull-down list. All the traits present in the file will<br />
be on the list.<br />
4. For each trait, the information pane on the right displays Win<strong>QTL</strong>Cart's statistical summary of the