Windows QTL Cartographer 2.5 - FTP Directory Listing
Windows QTL Cartographer 2.5 - FTP Directory Listing
Windows QTL Cartographer 2.5 - FTP Directory Listing

Create successful ePaper yourself
Turn your PDF publications into a flip-book with our unique Google optimized e-Paper software.
74<br />
Mt-MIM Control File<br />
<strong>Windows</strong> <strong>QTL</strong> <strong>Cartographer</strong> <strong>2.5</strong><br />
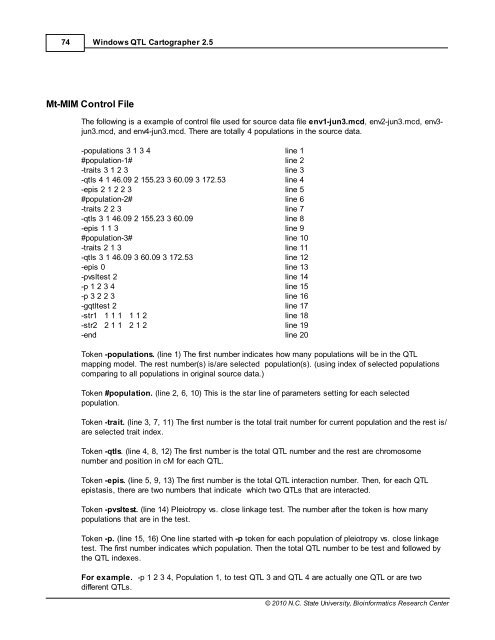
The following is a example of control file used for source data file env1-jun3.mcd, env2-jun3.mcd, env3jun3.mcd,<br />
and env4-jun3.mcd. There are totally 4 populations in the source data.<br />
-populations 3 1 3 4 line 1<br />
#population-1# line 2<br />
-traits 3 1 2 3 line 3<br />
-qtls 4 1 46.09 2 155.23 3 60.09 3 17<strong>2.5</strong>3 line 4<br />
-epis 2 1 2 2 3 line 5<br />
#population-2# line 6<br />
-traits 2 2 3 line 7<br />
-qtls 3 1 46.09 2 155.23 3 60.09 line 8<br />
-epis 1 1 3 line 9<br />
#population-3# line 10<br />
-traits 2 1 3 line 11<br />
-qtls 3 1 46.09 3 60.09 3 17<strong>2.5</strong>3 line 12<br />
-epis 0 line 13<br />
-pvsltest 2 line 14<br />
-p 1 2 3 4 line 15<br />
-p 3 2 2 3 line 16<br />
-gqtltest 2 line 17<br />
-str1 1 1 1 1 1 2 line 18<br />
-str2 2 1 1 2 1 2 line 19<br />
-end line 20<br />
Token -populations. (line 1) The first number indicates how many populations will be in the <strong>QTL</strong><br />
mapping model. The rest number(s) is/are selected population(s). (using index of selected populations<br />
comparing to all populations in original source data.)<br />
Token #population. (line 2, 6, 10) This is the star line of parameters setting for each selected<br />
population.<br />
Token -trait. (line 3, 7, 11) The first number is the total trait number for current population and the rest is/<br />
are selected trait index.<br />
Token -qtls. (line 4, 8, 12) The first number is the total <strong>QTL</strong> number and the rest are chromosome<br />
number and position in cM for each <strong>QTL</strong>.<br />
Token -epis. (line 5, 9, 13) The first number is the total <strong>QTL</strong> interaction number. Then, for each <strong>QTL</strong><br />
epistasis, there are two numbers that indicate which two <strong>QTL</strong>s that are interacted.<br />
Token -pvsltest. (line 14) Pleiotropy vs. close linkage test. The number after the token is how many<br />
populations that are in the test.<br />
Token -p. (line 15, 16) One line started with -p token for each population of pleiotropy vs. close linkage<br />
test. The first number indicates which population. Then the total <strong>QTL</strong> number to be test and followed by<br />
the <strong>QTL</strong> indexes.<br />
For example. -p 1 2 3 4, Population 1, to test <strong>QTL</strong> 3 and <strong>QTL</strong> 4 are actually one <strong>QTL</strong> or are two<br />
different <strong>QTL</strong>s.<br />
© 2010 N.C. State University, Bioinformatics Research Center