Windows QTL Cartographer 2.5 - FTP Directory Listing
Windows QTL Cartographer 2.5 - FTP Directory Listing
Windows QTL Cartographer 2.5 - FTP Directory Listing
You also want an ePaper? Increase the reach of your titles
YUMPU automatically turns print PDFs into web optimized ePapers that Google loves.
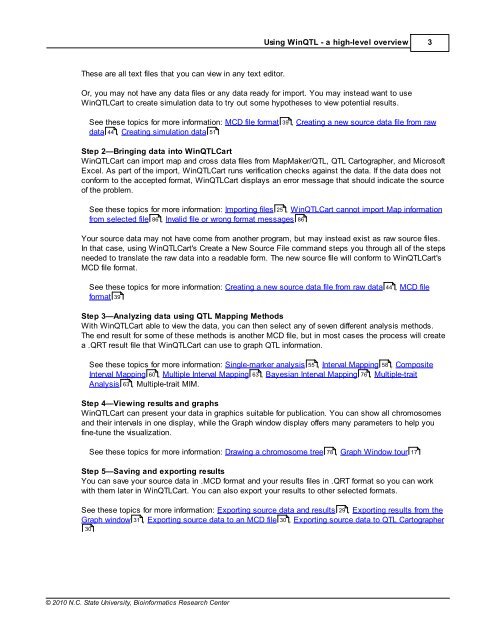
These are all text files that you can view in any text editor.<br />
© 2010 N.C. State University, Bioinformatics Research Center<br />
Using Win<strong>QTL</strong> - a high-level overview 3<br />
Or, you may not have any data files or any data ready for import. You may instead want to use<br />
Win<strong>QTL</strong>Cart to create simulation data to try out some hypotheses to view potential results.<br />
See these topics for more information: MCD file format 39 , Creating a new source data file from raw<br />
data 44 , Creating simulation data 51<br />
Step 2—Bringing data into Win<strong>QTL</strong>Cart<br />
Win<strong>QTL</strong>Cart can import map and cross data files from MapMaker/<strong>QTL</strong>, <strong>QTL</strong> <strong>Cartographer</strong>, and Microsoft<br />
Excel. As part of the import, Win<strong>QTL</strong>Cart runs verification checks against the data. If the data does not<br />
conform to the accepted format, Win<strong>QTL</strong>Cart displays an error message that should indicate the source<br />
of the problem.<br />
See these topics for more information: Importing files 25 , Win<strong>QTL</strong>Cart cannot import Map information<br />
from selected file 86 , Invalid file or wrong format messages 86<br />
Your source data may not have come from another program, but may instead exist as raw source files.<br />
In that case, using Win<strong>QTL</strong>Cart's Create a New Source File command steps you through all of the steps<br />
needed to translate the raw data into a readable form. The new source file will conform to Win<strong>QTL</strong>Cart's<br />
MCD file format.<br />
See these topics for more information: Creating a new source data file from raw data 44 , MCD file<br />
format 39<br />
Step 3—Analyzing data using <strong>QTL</strong> Mapping Methods<br />
With Win<strong>QTL</strong>Cart able to view the data, you can then select any of seven different analysis methods.<br />
The end result for some of these methods is another MCD file, but in most cases the process will create<br />
a .QRT result file that Win<strong>QTL</strong>Cart can use to graph <strong>QTL</strong> information.<br />
See these topics for more information: Single-marker analysis 55 , Interval Mapping 58 , Composite<br />
Interval Mapping 60 , Multiple Interval Mapping 63 , Bayesian Interval Mapping 76 , Multiple-trait<br />
Analysis 63 , Multiple-trait MIM.<br />
Step 4—Viewing results and graphs<br />
Win<strong>QTL</strong>Cart can present your data in graphics suitable for publication. You can show all chromosomes<br />
and their intervals in one display, while the Graph window display offers many parameters to help you<br />
fine-tune the visualization.<br />
See these topics for more information: Drawing a chromosome tree , Graph Window tour<br />
78 17<br />
Step 5—Saving and exporting results<br />
You can save your source data in .MCD format and your results files in .QRT format so you can work<br />
with them later in Win<strong>QTL</strong>Cart. You can also export your results to other selected formats.<br />
See these topics for more information: Exporting source data and results 29 , Exporting results from the<br />
Graph window 31 , Exporting source data to an MCD file 30 , Exporting source data to <strong>QTL</strong> <strong>Cartographer</strong><br />
30


