Windows QTL Cartographer 2.5 - FTP Directory Listing
Windows QTL Cartographer 2.5 - FTP Directory Listing
Windows QTL Cartographer 2.5 - FTP Directory Listing

You also want an ePaper? Increase the reach of your titles
YUMPU automatically turns print PDFs into web optimized ePapers that Google loves.
78<br />
<strong>Windows</strong> <strong>QTL</strong> <strong>Cartographer</strong> <strong>2.5</strong><br />
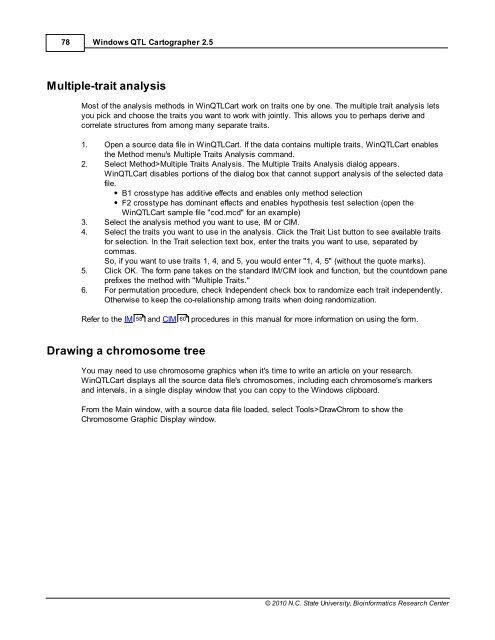
Multiple-trait analysis<br />
Most of the analysis methods in Win<strong>QTL</strong>Cart work on traits one by one. The multiple trait analysis lets<br />
you pick and choose the traits you want to work with jointly. This allows you to perhaps derive and<br />
correlate structures from among many separate traits.<br />
1. Open a source data file in Win<strong>QTL</strong>Cart. If the data contains multiple traits, Win<strong>QTL</strong>Cart enables<br />
the Method menu's Multiple Traits Analysis command.<br />
2. Select Method>Multiple Traits Analysis. The Multiple Traits Analysis dialog appears.<br />
Win<strong>QTL</strong>Cart disables portions of the dialog box that cannot support analysis of the selected data<br />
file.<br />
B1 crosstype has additive effects and enables only method selection<br />
F2 crosstype has dominant effects and enables hypothesis test selection (open the<br />
Win<strong>QTL</strong>Cart sample file "cod.mcd" for an example)<br />
3. Select the analysis method you want to use, IM or CIM.<br />
4. Select the traits you want to use in the analysis. Click the Trait List button to see available traits<br />
for selection. In the Trait selection text box, enter the traits you want to use, separated by<br />
commas.<br />
So, if you want to use traits 1, 4, and 5, you would enter "1, 4, 5" (without the quote marks).<br />
5. Click OK. The form pane takes on the standard IM/CIM look and function, but the countdown pane<br />
prefixes the method with "Multiple Traits."<br />
6. For permutation procedure, check Independent check box to randomize each trait independently.<br />
Otherwise to keep the co-relationship among traits when doing randomization.<br />
Refer to the IM 58 and CIM 60<br />
procedures in this manual for more information on using the form.<br />
Drawing a chromosome tree<br />
You may need to use chromosome graphics when it's time to write an article on your research.<br />
Win<strong>QTL</strong>Cart displays all the source data file's chromosomes, including each chromosome's markers<br />
and intervals, in a single display window that you can copy to the <strong>Windows</strong> clipboard.<br />
From the Main window, with a source data file loaded, select Tools>DrawChrom to show the<br />
Chromosome Graphic Display window.<br />
© 2010 N.C. State University, Bioinformatics Research Center