Windows QTL Cartographer 2.5 - FTP Directory Listing
Windows QTL Cartographer 2.5 - FTP Directory Listing
Windows QTL Cartographer 2.5 - FTP Directory Listing

Create successful ePaper yourself
Turn your PDF publications into a flip-book with our unique Google optimized e-Paper software.
76<br />
<strong>Windows</strong> <strong>QTL</strong> <strong>Cartographer</strong> <strong>2.5</strong><br />
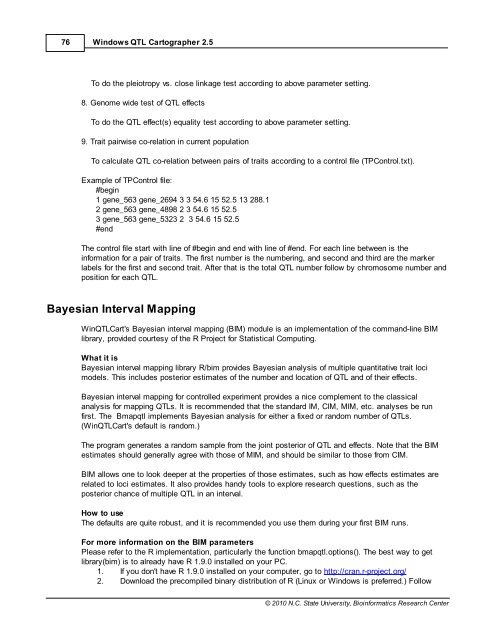
To do the pleiotropy vs. close linkage test according to above parameter setting.<br />
8. Genome wide test of <strong>QTL</strong> effects<br />
To do the <strong>QTL</strong> effect(s) equality test according to above parameter setting.<br />
9. Trait pairwise co-relation in current population<br />
To calculate <strong>QTL</strong> co-relation between pairs of traits according to a control file (TPControl.txt).<br />
Example of TPControl file:<br />
#begin<br />
1 gene_563 gene_2694 3 3 54.6 15 5<strong>2.5</strong> 13 288.1<br />
2 gene_563 gene_4898 2 3 54.6 15 5<strong>2.5</strong><br />
3 gene_563 gene_5323 2 3 54.6 15 5<strong>2.5</strong><br />
#end<br />
The control file start with line of #begin and end with line of #end. For each line between is the<br />
information for a pair of traits. The first number is the numbering, and second and third are the marker<br />
labels for the first and second trait. After that is the total <strong>QTL</strong> number follow by chromosome number and<br />
position for each <strong>QTL</strong>.<br />
Bayesian Interval Mapping<br />
Win<strong>QTL</strong>Cart's Bayesian interval mapping (BIM) module is an implementation of the command-line BIM<br />
library, provided courtesy of the R Project for Statistical Computing.<br />
What it is<br />
Bayesian interval mapping library R/bim provides Bayesian analysis of multiple quantitative trait loci<br />
models. This includes posterior estimates of the number and location of <strong>QTL</strong> and of their effects.<br />
Bayesian interval mapping for controlled experiment provides a nice complement to the classical<br />
analysis for mapping <strong>QTL</strong>s. It is recommended that the standard IM, CIM, MIM, etc. analyses be run<br />
first. The Bmapqtl implements Bayesian analysis for either a fixed or random number of <strong>QTL</strong>s.<br />
(Win<strong>QTL</strong>Cart's default is random.)<br />
The program generates a random sample from the joint posterior of <strong>QTL</strong> and effects. Note that the BIM<br />
estimates should generally agree with those of MIM, and should be similar to those from CIM.<br />
BIM allows one to look deeper at the properties of those estimates, such as how effects estimates are<br />
related to loci estimates. It also provides handy tools to explore research questions, such as the<br />
posterior chance of multiple <strong>QTL</strong> in an interval.<br />
How to use<br />
The defaults are quite robust, and it is recommended you use them during your first BIM runs.<br />
For more information on the BIM parameters<br />
Please refer to the R implementation, particularly the function bmapqtl.options(). The best way to get<br />
library(bim) is to already have R 1.9.0 installed on your PC.<br />
1. If you don't have R 1.9.0 installed on your computer, go to http://cran.r-project.org/<br />
2. Download the precompiled binary distribution of R (Linux or <strong>Windows</strong> is preferred.) Follow<br />
© 2010 N.C. State University, Bioinformatics Research Center