Windows QTL Cartographer 2.5 - FTP Directory Listing
Windows QTL Cartographer 2.5 - FTP Directory Listing
Windows QTL Cartographer 2.5 - FTP Directory Listing

You also want an ePaper? Increase the reach of your titles
YUMPU automatically turns print PDFs into web optimized ePapers that Google loves.
54<br />
<strong>Windows</strong> <strong>QTL</strong> <strong>Cartographer</strong> <strong>2.5</strong><br />
Next Trait. Click this button to reach each trait and you can set following parameters.<br />
<strong>QTL</strong> numbers. Set the number of <strong>QTL</strong>s to appear in the file.<br />
Heritability. Requires a value in the range 0.0 to 1.0. Default is 0.8.<br />
Vd/Va. Dominant variance/Additive variance<br />
Vi/Va. Epistatic variance/Additive variance<br />
For the Additive, Dominant, and Epistatic effects you want to see in the simulation, you can select<br />
the following:<br />
Effects direction<br />
Same—All values are positive<br />
Both—Values are positive and negative<br />
Sign's Ratio—Ratio of negative:positive.<br />
Effects distribution<br />
Equal—All effects have the same value<br />
Normal—Values derive from normal distribution<br />
Gamma—Values derive from gamma distribution<br />
Parameter—Value for gamma distribution<br />
Note For more information on effects distribution and the additive, dominant, and epistatic effects,<br />
please refer to the <strong>QTL</strong> <strong>Cartographer</strong>'s manual.<br />
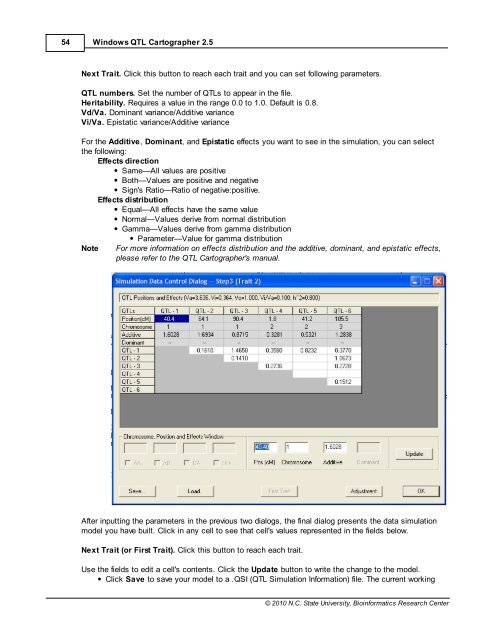
After inputting the parameters in the previous two dialogs, the final dialog presents the data simulation<br />
model you have built. Click in any cell to see that cell's values represented in the fields below.<br />
Next Trait (or First Trait). Click this button to reach each trait.<br />
Use the fields to edit a cell's contents. Click the Update button to write the change to the model.<br />
Click Save to save your model to a .QSI (<strong>QTL</strong> Simulation Information) file. The current working<br />
© 2010 N.C. State University, Bioinformatics Research Center