Windows QTL Cartographer 2.5 - FTP Directory Listing
Windows QTL Cartographer 2.5 - FTP Directory Listing
Windows QTL Cartographer 2.5 - FTP Directory Listing
You also want an ePaper? Increase the reach of your titles
YUMPU automatically turns print PDFs into web optimized ePapers that Google loves.
© 2010 N.C. State University, Bioinformatics Research Center<br />
Tutorials 85<br />
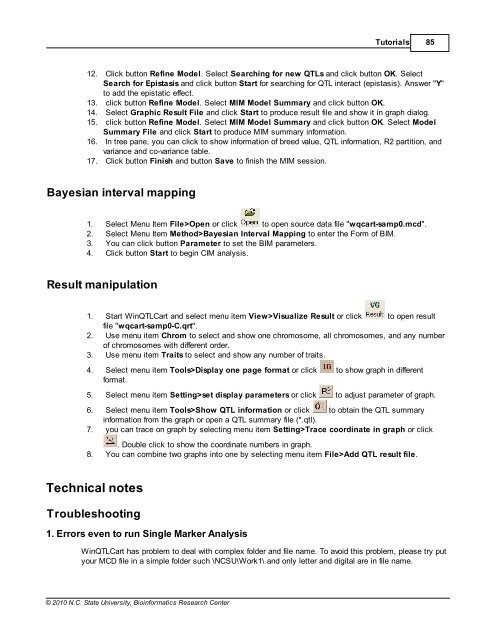
12. Click button Refine Model. Select Searching for new <strong>QTL</strong>s and click button OK. Select<br />
Search for Epistasis and click button Start for searching for <strong>QTL</strong> interact (epistasis). Answer "Y"<br />
to add the epistatic effect.<br />
13. click button Refine Model. Select MIM Model Summary and click button OK.<br />
14. Select Graphic Result File and click Start to produce result file and show it in graph dialog.<br />
15. click button Refine Model. Select MIM Model Summary and click button OK. Select Model<br />
Summary File and click Start to produce MIM summary information.<br />
16. In tree pane, you can click to show information of breed value, <strong>QTL</strong> information, R2 partition, and<br />
variance and co-variance table.<br />
17. Click button Finish and button Save to finish the MIM session.<br />
Bayesian interval mapping<br />
1. Select Menu Item File>Open or click to open source data file "wqcart-samp0.mcd".<br />
2. Select Menu Item Method>Bayesian Interval Mapping to enter the Form of BIM.<br />
3. You can click button Parameter to set the BIM parameters.<br />
4. Click button Start to begin CIM analysis.<br />
Result manipulation<br />
1. Start Win<strong>QTL</strong>Cart and select menu item View>Visualize Result or click to open result<br />
file "wqcart-samp0-C.qrt".<br />
2. Use menu item Chrom to select and show one chromosome, all chromosomes, and any number<br />
of chromosomes with different order.<br />
3. Use menu item Traits to select and show any number of traits.<br />
4. Select menu item Tools>Display one page format or click to show graph in different<br />
format.<br />
5. Select menu item Setting>set display parameters or click to adjust parameter of graph.<br />
6. Select menu item Tools>Show <strong>QTL</strong> information or click to obtain the <strong>QTL</strong> summary<br />
information from the graph or open a <strong>QTL</strong> summary file (*.qtl).<br />
7. you can trace on graph by selecting menu item Setting>Trace coordinate in graph or click<br />
. Double click to show the coordinate numbers in graph.<br />
8. You can combine two graphs into one by selecting menu item File>Add <strong>QTL</strong> result file.<br />
Technical notes<br />
Troubleshooting<br />
1. Errors even to run Single Marker Analysis<br />
Win<strong>QTL</strong>Cart has problem to deal with complex folder and file name. To avoid this problem, please try put<br />
your MCD file in a simple folder such \NCSU\Work1\ and only letter and digital are in file name.


