

Financial systems and development
Financial systems and development
Financial systems and development

Create successful ePaper yourself
Turn your PDF publications into a flip-book with our unique Google optimized e-Paper software.
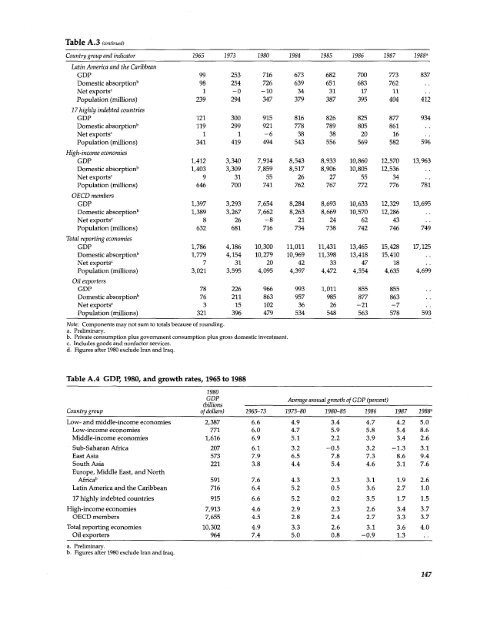
Table A.3 (continued)<br />
Country group <strong>and</strong> indicator 1965 1973 1980 1984 1985 1986 1987 1988'<br />
Latin America <strong>and</strong> the Caribbean<br />
GDP 99 253 716 673 682 700 773 837<br />
Domestic absorptionb 98 254 726 639 651 683 762<br />
Net exports' 1 - 0 -10 34 31 17 11<br />
Population (millions) 239 294 347 379 387 395 404 412<br />
17 highly indebted countries<br />
GDP 121 300 915 816 826 825 877 934<br />
Domestic absorptionb 119 299 921 778 789 805 861<br />
Net exports' 1 1 -6 38 38 20 16<br />
Population (millions) 341 419 494 543 556 569 582 596<br />
High-incomeconomies<br />
GDP 1,412 3,340 7,914 8,543 8,933 10,860 12,570 13,963<br />
Domestic absorptionb 1,403 3,309 7,859 8,517 8,906 10,805 12,536<br />
Net exports' 9 31 55 26 27 55 34<br />
Population (millions) 646 700 741 762 767 772 776 781<br />
OECD members<br />
GDP 1,397 3,293 7,654 8,284 8,693 10,633 12,329 13,695<br />
Domestic absorptionb 1,389 3,267 7,662 8,263 8,669 10,570 12,286<br />
Net exports' 8 26 -8 21 24 62 43<br />
Population (millions) 632 681 716 734 738 742 746 749<br />
Total reporting economies<br />
GDP 1,786 4,186 10,300 11,011 11,431 13,465 15,428 17,125<br />
Domestic absorptionb 1,779 4,154 10,279 10,969 11,398 13,418 15,410<br />
Net exportsc 7 31 20 42 33 47 18<br />
Population (millions) 3,021 3,595 4,095 4,397 4,472 4,554 4,635 4,699<br />
Oil exporters<br />
GDP 78 226 966 993 1,011 855 855<br />
Domestic absorptionb 76 211 863 957 985 877 863<br />
Net exports' 3 15 102 36 26 -21 -7<br />
Population (millions) 321 396 479 534 548 563 578 593<br />
Note: Components may not sum to totals because of rounding.<br />
a. Preliminary.<br />
b. Private consumption plus government consumption plus gross domestic investment.<br />
c. Includes goods <strong>and</strong> nonfactor services.<br />
d. Figures after 1980 exclude Iran <strong>and</strong> Iraq.<br />
Table A.4 GDP, 1980, <strong>and</strong> growth rates, 1965 to 1988<br />
1980<br />
GDP<br />
Average annual growth of GDP (percent)<br />
(billions<br />
A<br />
Country group of dollars) 1965-73 1973-80 1980-85 1986 1987 1988a<br />
Low- <strong>and</strong> middle-income economies 2,387 6.6 4.9 3.4 4.7 4.2 5.0<br />
Low-income economies 771 6.0 4.7 5.9 5.8 5.4 8.6<br />
Middle-income economies 1,616 6.9 5.1 2.2 3.9 3.4 2.6<br />
Sub-Saharan Africa 207 6.1 3.2 -0.5 3.2 -1.3 3.1<br />
East Asia 573 7.9 6.5 7.8 7.3 8.6 9.4<br />
South Asia 221 3.8 4.4 5.4 4.6 3.1 7.6<br />
Europe, Middle East, <strong>and</strong> North<br />
Africab 591 7.6 4.3 2.3 3.1 1.9 2.6<br />
Latin America <strong>and</strong> the Caribbean 716 6.4 5.2 0.5 3.6 2.7 1.0<br />
17 highly indebted countries 915 6.6 5.2 0.2 3.5 1.7 1.5<br />
High-income economies 7,913 4.6 2.9 2.3 2.6 3.4 3.7<br />
OECD members 7,655 4.5 2.8 2.4 2.7 3.3 3.7<br />
Total reporting economies 10,302 4.9 3.3 2.6 3.1 3.6 4.0<br />
Oil exporters 964 7.4 5.0 0.8 -0.9 1.3<br />
a. Preliminary.<br />
b. Figures after 1980 exclude Iran <strong>and</strong> Iraq.<br />
147


