

Financial systems and development
Financial systems and development
Financial systems and development

You also want an ePaper? Increase the reach of your titles
YUMPU automatically turns print PDFs into web optimized ePapers that Google loves.
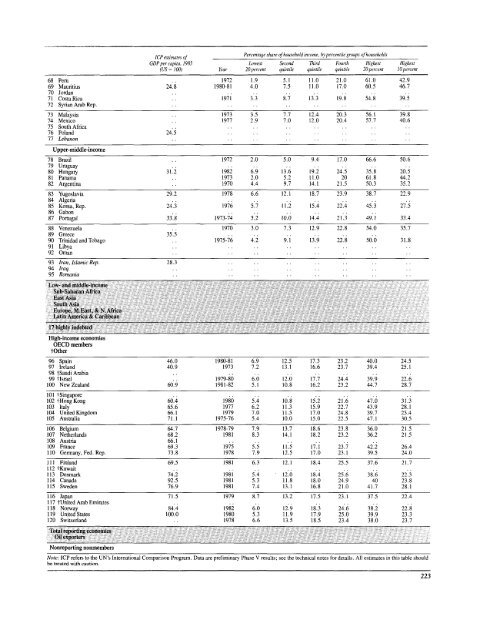
I'CP estimates of<br />
Percentage share of household income, byv percentile groups of households<br />
GDP per capita, 1985 Lowest Second Third Fourth Highest Highest<br />
2<br />
(US =1001 Year 20 percent quintile quintile quintile 0percent 10 percent<br />
68 Peru .1972 1.9 5.1 11.0 21.0 61.0 42.9<br />
69 Mauritius 24.8 1980-81 4.0 7.5 11.0 17.0 60.5 46.7<br />
70 Jordan... .. .<br />
71Costa Rica .1971 3.3 8.7 13.3 19.8 54.8 39.5<br />
72 Syrian Arab Rep.... .... ...<br />
73 Malayuia . 1973 3.5 7.7 12.4 20.3 56.1 39.8<br />
74 Mexico .. 1977 2.9 7.0 12.0 20.4 57.7 40.6<br />
75 South Africa . ..<br />
76 Pol<strong>and</strong> 24.5 . .. ..<br />
77 Lebanon ... .. ..<br />
Upper-middle-income<br />
78 Brazil .1972 2.0 5.0 9.4 17.0 66.6 50.6<br />
79 Uruguay .. ... .<br />
80 Hungary 31.2 1982 6.9 13.6 19.2 24.5 35.8 20.5<br />
81 Panama . 1973 2.0 5.2 11.0 20 61.8 44.2<br />
82 Argentina . 1970 4.4 9.7 14.1 21.5 50.3 35.2<br />
83 Yugoslavia 29.2 1978 6.6 12.1 18.7 23.9 38.7 22.9<br />
84 Algeria . . . ..<br />
85 Korea, Rep. 24.3 1976 5.7 11.2 15.4 22.4 45.3 27.5<br />
86 Gabon .... .<br />
87 Portugal 33.8 1973-74 5.2 10.0 14.4 21.3 49.1 33.4<br />
88 Venezuela .1970 3.0 7.3 12.9 22.8 54.0 35.7<br />
89 Greece 35.5 ... .. .<br />
90 Trinidad <strong>and</strong> Tobago . 1975-76 4.2 9.1 13.9 22.8 50.0 31.8<br />
91 Libya ... .. ..<br />
92 Oman ..... .<br />
93 Irean, Islamic Rep. 28.3 . .... .. ...<br />
94 Iraq ... .<br />
95 Romania . . ....<br />
Low- <strong>and</strong> miiddle-income<br />
Sub-Sabaran Africa<br />
East Asia<br />
South Asia<br />
Europe, M.East, & N.Africa<br />
Latin America & Caribbean<br />
17 highly indebted<br />
High-incomeconomies<br />
OECD members<br />
tOtber<br />
96 Spain 46.0 1980-81 6.9 12.5 17.3 23.2 40.0 24.5<br />
97 Irel<strong>and</strong> 40.9 1973 7.2 13.1 16.6 23.7 39.4 25.1<br />
98 tSaudi Arabia ... .. ..<br />
99 tIsrael . 1979-80 6.0 12.0 17.7 24.4 39.9 22.6<br />
100 New Zeal<strong>and</strong> 60.9 1981-82 5.1 10.8 16.2 23.2 44.7 28.7<br />
101 tSingapore .. .<br />
102 -tHong Kong 60.4 1980 5.4 10.8 15.2 21.6 47.0 31.3<br />
103 Itly 65.6 1977 6.2 11.3 15.9 22.7 43.9 28.1<br />
104 United Kingdom 66.1 1979 7.0 11.5 17.0 24.8 39.7 23.4<br />
105 Australia 71.1 1975-76 5.4 10.0 15.0 22.5 47.1 30.5<br />
106 Belgium 64.7 1978-79 7.9 13.7 18.6 23.8 36.0 21.5<br />
107 Netheri<strong>and</strong>s 68.2 1981 8.3 14.1 18.2 23.2 36.2 21.5<br />
108 Austria 66.1 . .... ..<br />
109 France 69.3 1975 5.5 11.5 17.1 23.7 42.2 26.4<br />
110 Germany,Fed.Rep. 73.8 1978 7.9 12.5 17.0 23.1 39.5 24.0<br />
II1 Finl<strong>and</strong> 69.5 1981 6.3 12.1 18.4 25.5 37.6 21.7<br />
113 Denmark 74.2 1981 5.4 12.0 18.4 25.6 38.6 22. 3<br />
114 Canada 92.5 1981 5.3 11.8 18.0 24.9 40 23.8<br />
115 Sweden 76.9 1981 7.4 13.1 16.8 21.0 41.7 28.1<br />
116 Japan 71.5 1979 8.7 13.2 17.5 23.1 37.5 22.4<br />
117 fUnited Arab Emirates .... . ... .<br />
118 Norway 84.4 1982 6.0 12.9 18.3 24.6 38.2 22.8<br />
119 UnitedStates 100.0 1980 5.3 11.9 17.9 25.0 39.9 23.3<br />
120 Switzerl<strong>and</strong> . 1978 6.6 13.5 18.5 23.4 38.0 23.7<br />
Total reporting economies<br />
Oil exporters<br />
Nonreporting nonmembers<br />
Note: ICP refers to the UN's Intemational Comparison Program. Data are preliminary Phase V results; see the technical notes for details. All estimates in this table should<br />
be treated with caution.<br />
223


