

Financial systems and development
Financial systems and development
Financial systems and development

You also want an ePaper? Increase the reach of your titles
YUMPU automatically turns print PDFs into web optimized ePapers that Google loves.
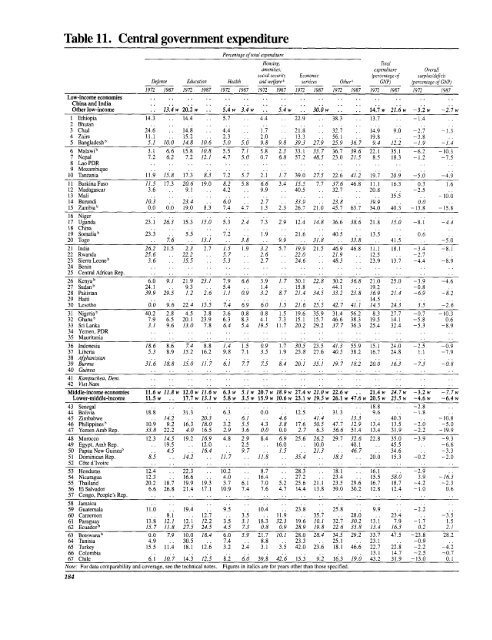
Table 11. Central government expenditure<br />
Percentage oftotal expenditure<br />
Housing,<br />
Total<br />
amenities; expenditure Overall<br />
social security Economic fpereentage of surplusldeficit<br />
Defense Education Health <strong>and</strong> welfare services Other' GNP) (percentage of GNP)<br />
1972 1987 1972 1987 T9_i2 1987 1972 1987 1 i72 1987 1972 1987 1972 1987 1972 1987<br />
Low-income economies<br />
China <strong>and</strong> India<br />
Other low-income 13.4 w 20.2w S.4 w 3.4 w 5.4 30.0 w -. 14.7 w. 21.6 w - 3.2 w -2. 7 4,<br />
1 Ethiopia 143 14.4 5.7 4.4 22.9 39.3 13.7 - 1.4<br />
2 Bhutan<br />
3 Chad 24.6 14.8 4.4 1.7 21.8 32.7 14.9 9.0 -2.7 - 1.3<br />
4 Zaire 11.1 15.2 2.3 2.0 13.3 56.1 19.8 -3.8<br />
5 Bangladesh 1 5.1 10.0 14.8 10. 6 5.0 5.0 9.8 9.8 39.3 27.9 25.9 36 7 9.4 12.2 -1.9 -1.4<br />
6 MalaWib 3.1 6.6 15.9 10.8 5.5 7 1 5.8 2.3 33.1 33.7 36.7 39.6 22.1 35.1 -6.2 - 10.3<br />
7 Nepal 7.2 6 2 7.2 12.1 4.7 5.0 0.7 6 8 57.2 48.5 23.0 21.5 8.5 18.3 - 1.2 -7.5<br />
8 Lao PDR<br />
9 Mozambique<br />
10 Tanzania 11.9 15.8 17.3 8.3 7.2 5. 7 2.1 1. 7 39.0 27.5 22.6 41.2 19.7 20.9 -5.0 -4.9<br />
It Burkina Faso 11.5 17.3 20.6 19.0 8.2 5.8 6 6 3.4 15.5 7.7 37.6 46.8 11.1 16.3 0.3 1.6<br />
12 Madagascar 3.6 9.1 4.2 9.9 40.5 32.7 20.8 -2.5<br />
13 Mali 35.5 - 10.0<br />
14 Burundi 10.3 23.4 6.0 2.7 33.9 23.8 19.9 0.0<br />
15 Zambia b 0.0 0.0 19.0 8.3 7.4 4.7 1.3 2.3 26.7 21.0 45.7 63.7 34.0 40.3 - 13.8 - 15.8<br />
16 Niger<br />
17 Ug<strong>and</strong>a 23.1 263 15.3 15.0 5.3 2.4 7.3 2.9 12.4 14.8 36.6 38.6 21.8 15.0 -8. I - 4.4<br />
19 China<br />
19 Somaiia 23.3 5.5 7.2 1.9 21.6 40.5 13.5 0.6<br />
20 Togo 7.6 .. 13.1 .. 3.8 .. 9.9 .. 31.8 .. 33.8 .. 41.5 - 5.0<br />
21 India 26.2 21,5 2.3 2.7 1.5 1.9 3.2 5.7 19.9 21.5 46.9 46.8 11.1 18.1 - 3.4 - 8.1<br />
22 Rw<strong>and</strong>a 25.6 22.2 5.7 2.6 22.0 21.9 12.5 - 2.7<br />
23 SicTra Leone b 3.6 15.5 53 2.7 24.6 48.3 23.9 13.7 -4.4 -8.9<br />
24 Benin<br />
25 Centml African Rep.<br />
26 Kenya' 6.0 9.1 21.9 23.1 7.9 6 6 3.9 1. 7 30.1 22.8 30.2 368 21.0 25.0 -3.9 -4.6<br />
27 Sudan 1 24.1 9.3 5.4 i.4 .. 15.8 .. 44.1 .. 19.2 -0.8<br />
28 Pakistan 39.9 29.5 1.2 2.6 1.1 0.9 3.2 8. 7 21.4 34.5 33.2 23.8 169 21.4 -69 - 8. 2<br />
29 Haiti 14.5<br />
30 Lesotho 0.0 9.6 22.4 15.5 7.4 6.9 6 0 1.5 21.6 25.5 42.7 41.1 14.5 24.3 3.5 -2.6<br />
31 Nigeria 1 40.2 2.8 4.5 2.8 3.6 0.8 0.8 1.5 19.6 35.9 31.4 56.2 8.3 27.7 - 0.7 - 10.3<br />
32 Ghana' 7.9 6.5 20.1 23.9 6.3 8.3 4.1 7.3 15.1 15.7 46.6 38.3 19.5 14.1 -5.8 0.6<br />
33 SriLanka 3.1 9.6 13.0 7.8 6 4 5.4 19.5 11.7 20.2 29.2 37 7 36.3 25.4 32.4 -5.3 - 8.9<br />
34 Yemen, PDR<br />
35 Mauritania<br />
36 Indonesia 18.6 8.6 74 8.8 1.4 1.5 0.9 1.7 30.5 23.5 41.3 55.9 15.1 24.0 -2.5 -0.9<br />
37 Libefia 5.3 8.9 15.2 16.2 9.8 7.1 3,5 1.9 25.8 27.6 40.5 38.2 16.7 24.8 1.1 -7.9<br />
38 Afghanistan<br />
39 Burma 31.6 18.8 15.0 ]I. 7 6 1 7. 7 75 8.4 20.1 35.1 19.7 18.2 20.0 163 - 7.3 -0.8<br />
40 Guinea<br />
41 Kampuchea, Dem.<br />
42 Viet Nam<br />
Middle-income economies 11.6 w 11.8 w 12.0 w 11.6 w 6.3 w 5.1 w 20.7 w 18.9 w 27.4 w 21.0 w 22.6 w 21.4 w 24.7 w -3.2 w - 7.7 w<br />
Lower-middle-incorne 11.5 w 17.7 w 13.1 w 5.9 w 3.5 w 15.9 w 10. 6 w 23.1 w 19.5 w 26.1 w 47.6 w 20.5 w 25.5 w -4.6 w -6.4 w<br />
43 Senegal 18.8 -2.8<br />
44 Bolivia 19.9 31.3 6.3 0.0 12.5 31.3 9.6 - 1.9<br />
45 Zimbabwe . . 14.2 . . 20.3 . . 6 1 . . 4.6 . . 41.4 . . 13.3 . . 40.3 . . - 10.8<br />
46 Philippines' 10.9 9.2 16.3 18.0 3.2 5.5 4.3 3.8 17.6 50.5 47.7 12.9 13.4 13.5 -2.0 -5.0<br />
47 Yemen Arab Rep. 33.8 22.2 4.0 16.5 2.9 3.6 0.0 0.0 2.7 6.3 56.6 51.4 13.4 31.9 -2.2 -19.9<br />
48 Morocco 12.3 14.5 19.2 169 4.8 2.9 8.4 69 25.6 262 29.7 32.6 22.8 35.0 -3.9 -9.3<br />
49 Egypt, Arab Rep. 19.5 12.0 2.5 16.0 10.0 40.1 45.5 -6.6<br />
50 Papua New Guinea' 4.5 164 9.7 1.5 21.3 46 7 34.6 -3.3<br />
51 Dominican Rep. 8.5 14.2 11.7 11.8 35.4 18.3 20,0 15.3 -0.2 -2.0<br />
52 C6te d'Ivoire<br />
53 Honduras 12.4 22.3 10.2 8.7 28.3 I S. I 16.1 -2.9<br />
54 Nicaragua 12.3 16.6 4.0 16.4 27.2 23.4 15.5 58.0 3.9 -163<br />
55 Thail<strong>and</strong> 20.2 18.7 19.9 19.3 3.7 6.1 7.0 5.2 25.6 21.1 23.5 29.6 16.7 18.7 -4.2 -2.3<br />
56 El Salvadoy 6.6 26.8 21.4 17.1 10.9 7.4 7.6 4.7 14.4 13.8 39.0 30.2 12.8 12.4 - 1.0 0.6<br />
57 Congo, People's Rep.<br />
58 Jamaica<br />
59 Guatemala 11.0 19.4 9.5 10.4 23.8 25.8 9.9 -2.2<br />
60 Canieroon . . 8.1 . . 12.7 . . 3.5 . . 11.9 . . 35.7 . . 28.0 . . 23.4 . 1 -3,5<br />
61 Paraguay 13.9 12.1 12.1 12.2 3.5 3.1 183 32.3 19.6 103 32.7 30.2 13.1 7.9 - L7 1.5<br />
62 Ecuadorb 15. 7 11.8 27.5 24.5 4.5 73 0.8 0.9 28.9 19.8 22.6 35.8 13.4 1-63 0.2 2.1<br />
63 Botswana' 0.0 7.9 10.0 18.4 6.0 59 21.7 10.1 28.0 28,4 34.5 29.2 33.7 47.5 -23.8 28.2<br />
64 Tunisia 4.9 .. 30.5 7.4 8.8 .. 23.3 .. 25.1 .. 23.1 -0.9<br />
65 Tbrkey 15.5 11.4 18.1 12.6 3.2 2.4 3A 3.5 42.0 23.6 18.1 46.6 22.7 22.8 -2.2 -41<br />
66 Colombia 13.1 14.7 -2.5 -0.7<br />
67 Chile 6.1 10.7 14.3 12.5 8.2 6 0 39.8 42.6 15.3 9.2 16.3 19.0 43.2 31.9 -13.0 0.1<br />
Note: For data comparability <strong>and</strong> coverage, see the technical notes. Figures in italics are for years other than those specified.<br />
184


