

Financial systems and development
Financial systems and development
Financial systems and development

Create successful ePaper yourself
Turn your PDF publications into a flip-book with our unique Google optimized e-Paper software.
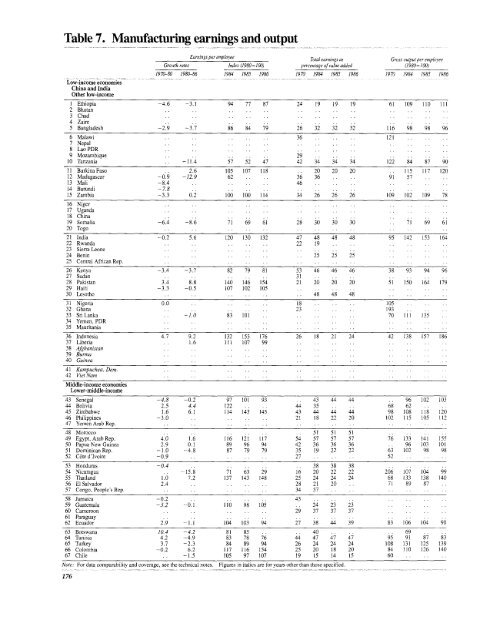
Table 7. Manufacturing earnings <strong>and</strong> output<br />
Lw-incomeconomies<br />
China <strong>and</strong> India<br />
Other low-income<br />
Earnings per employee<br />
Total earnings as<br />
Gross output per empioyee<br />
Growth rates Inex (1980=100) percentage ofvcaiue added (1980= 100)<br />
1970-80 1980-86 1984 1985 1986 1970 198.4 1985 1986 1970 1984 1985 1986<br />
I Ethiopia -4.6 -3.1 94 77 87 24 19 19 19 61 109 110 III<br />
2 Bhutan. ..<br />
3 Chad . ,,<br />
4 Zaire . .<br />
5 Bangladesh -2.9 -3.7 86 84 79 26 32 32 32 116 98 98 96<br />
6 Malawi . 36 121<br />
7 Nepal . ..<br />
8 Lao PDR . .<br />
9 Mozambiquse . .29<br />
10 Tanzania . 11.4 57 52 47 42 34 34 34 122 84 87 90<br />
11 Burkina Faso 2.6 105 107 118 . 20 20 20 . . 115 117 120<br />
12 Madagascar -0.9 -12.9 62 36 36 91 57 .<br />
13 Mali -8.4 46<br />
14 Burundi - 7.8 .<br />
15 Zambia -3.3 0.2 100 100 114 34 26 26 26 109 102 109 78<br />
16 Niger . ..<br />
17 Ug<strong>and</strong>a . I<br />
18 China .<br />
19 Somalia -6.4 -8.6 71 69 61 28 30 30 30 .. 71 69 61<br />
20 Togo . .<br />
21 India -0.2 5.6 120 130 132 47 48 48 48 95 142 153 164<br />
22 Rw<strong>and</strong>a . 22 19<br />
23 Sierra Leonie . ..<br />
24 Beanin. . 25 25 25<br />
25 Central African Rep. .<br />
26 Kenya -3.4 -3.7 82 79 81 53 46 46 46 38 93 94 96<br />
27 Sudan . 31<br />
28 Pakistan 3.4 8.8 140 146 154 21 20 20 20 51 150 164 179<br />
29 Haiti -3.3 -0.5 107 102 105<br />
30 Lesotho - - - 48 48 48<br />
31 Nigeria 0.0 .18 105<br />
32 Ghana . 23 193<br />
33 SriLanka . 1. 0 83 101 . 70 III 135<br />
34 Yemnen, PDR.. .<br />
35 Mauritania . ..<br />
36 Indonesia 4.7 9.2 132 153 176 26 18 21 24 42 138 157 186<br />
37 Liberia .. 1.6 III 107 99<br />
38 Afghanistan .. .<br />
39 Burma . .<br />
40 Guinea . .<br />
41 Kampuchea, Dem. . .<br />
42 Viet Nam . ..<br />
Middle-income economiies<br />
Lower-middle-income<br />
43 Senegal -4.8 -0.2 97 101 93 . 43 44 44 .. 96 102 103<br />
44 Bolivia 2.5 4.4 122 44 35 68 62 .<br />
45 Zimnbabwe 1.6 6.1 114 143 145 43 44 44 44 98 108 118 120<br />
46 Philippines -3.0 . 21 is 22 20 102 115 105 112<br />
47 Yemnen Arab Rep. .<br />
48 Morocco . 51 5I 51<br />
49 Egypt, Arab Rep. 4.0 1.6 116 121 117 54 57 57 57 76 133 141 155<br />
50 Papua New Guinea 2.9 0.1 89 96 94 42 36 36 36 - 96 103 101<br />
51 Dominican Rep. - 1.0 -4.8 87 79 79 35 19 22 22 63 102 98 98<br />
52 C6te d'Ivoire -0.9 .27 52 .<br />
53 Honduras -0.4 . . 38 38 38<br />
54 Nicaragua . - 15.8 71 63 29 16 20 22 22 206 107 104 99<br />
55 Thail<strong>and</strong> 1.0 7.2 137 143 148 25 24 24 24 68 133 138 140<br />
56 El Salvador 2.4 .28 21 20 . 71 89 87<br />
57 Congo, People's Rep. .. 34 57<br />
58 Jamaica -0.2 .43<br />
59 Guatemala -3.2 -0.1I 110 98 105 .. 24 23 23<br />
60 Cameroon .. 29 37 37 37<br />
61 Paraguay . .<br />
62 Ecuador 2.9 -1.1 104 103 94 27 38 44 39 83 106 104 90<br />
63 Botswana 10.4 -4.2 81 85 ... 40 .. . . 69<br />
64 Tunisia 4.2 -4.9 83 78 76 44 47 47 47 95 91 87 83<br />
65 Turkey 3.7 -2.3 84 89 94 26 24 24 24 108 131 125 139<br />
66 Columbia -0.2 6.2 117 116 154 25 20 18 20 84 110 126 140<br />
67 Chile .. -1.5 105 97 107 19 15 14 15 60<br />
Note: For data comparability <strong>and</strong> coverage, see the technical notes. Figures in italics are for years other than those specified.<br />
176


