- Page 1:
~~~~/ , -. \-E:-: - :: 0 0 - PUB768
- Page 4 and 5:
Oxford University Press NEW YORK OX
- Page 6 and 7:
countries' financial institutions i
- Page 8 and 9:
4 Financial sector issues in develo
- Page 10 and 11:
7.1 Shares of medium- and long-term
- Page 12 and 13:
* Fractional reserve banking. The p
- Page 14 and 15:
NTB Nontariff barrier * Growth rate
- Page 16 and 17:
and grew even faster in 1988 than i
- Page 18 and 19:
etter loan recovery procedures, mor
- Page 20 and 21:
l~ ~~~ ~ ~~~~~~~~~~~~~~~~~~~ ;:: ;
- Page 22 and 23:
The early years of the recovery wer
- Page 24 and 25:
Figure 1.4 Growth of export volume
- Page 26 and 27:
Figure 1.6 Saving and investment ra
- Page 28 and 29:
edly, in Argentina, Brazil, and Mex
- Page 30 and 31:
5~~~~ '~ ' S " ''t.*:'.: .:,0!3gft"
- Page 32 and 33:
Box 1.2 Debt concepts A variety of
- Page 34 and 35:
Table 1.1 Selected economic indicat
- Page 36 and 37:
Figure 1.8 Domestic and external li
- Page 38 and 39:
Box 1.3 Foreign equity investment E
- Page 40 and 41:
j Box 2.1 Life without money "Some
- Page 42 and 43:
other ways too. By imposing direct
- Page 44 and 45:
Box 2.2 Transaction costs and the s
- Page 46 and 47:
Box 2.3 Real interest rates and gro
- Page 48 and 49:
I Box 2.4 Swapping risk All economi
- Page 50 and 51:
Box 2.5 Deposit insurance Most high
- Page 52 and 53:
GOVERNMENT. As well as being regula
- Page 54 and 55:
and receivables, whereas developmen
- Page 56 and 57:
with the expansion of nonlocal trad
- Page 58 and 59:
over. Even so, bankers and industri
- Page 60 and 61:
Box 3.3 Financial swindles i Swindl
- Page 62 and 63:
Box 3.4 Financial underdevelopment
- Page 64 and 65:
Box 3.6 Universal banking One of th
- Page 66 and 67:
1960s. They speeded the internation
- Page 68 and 69:
4 Financial sector issues in develo
- Page 70 and 71:
Box 4.1 Directed credit in Turkey ,
- Page 72 and 73:
Box 4.2 Lending program for small e
- Page 74 and 75:
Box 4.4 The Botswana Development Co
- Page 76 and 77:
markets to finance their deficits,
- Page 78 and 79:
0~~~~~ = == X .. _- -- = -_ _ _ __
- Page 80 and 81:
Figure 4.3 Financial savings and th
- Page 82 and 83:
Box 4.8 Financial indexation in Bra
- Page 84 and 85:
Financial systems in distress Not s
- Page 86 and 87:
t !< 4> - !: e z u- >as uei- i.e_.S
- Page 88 and 89:
tem. They have succeeded in stemmin
- Page 90 and 91:
governments gave too little thought
- Page 92 and 93:
Box 5.4 The U.S. savings and loan c
- Page 94 and 95:
or take a step in the other directi
- Page 96 and 97:
have been even larger. The cost of
- Page 98 and 99:
~Foundations offinancial systems If
- Page 100 and 101:
(an issue closely related to the as
- Page 102 and 103:
several centuries. The spread of su
- Page 104 and 105:
Bankruptcy and reorganization monit
- Page 106 and 107:
Box 6.5 Elements of a bank supervis
- Page 108 and 109:
they attempted to discipline bank m
- Page 110 and 111:
Developing financial systems What s
- Page 112 and 113:
Figure 7.1 Shares of medium- and lo
- Page 114 and 115: Box 7.3 The financial history of a
- Page 116 and 117: Box 7.4 Housing finance The formal
- Page 118 and 119: Box 7.5 Bank modernization: Indones
- Page 120 and 121: DEVELOPMENT FINANCE INSTITUTIONS. T
- Page 122 and 123: esources in government securities o
- Page 124 and 125: strides in recent years in establis
- Page 126 and 127: Issues in informal finance Small-sc
- Page 128 and 129: Box 8.2 Rotating savings and credit
- Page 130 and 131: original amount to the renter by th
- Page 132 and 133: cooperatives' managers because it a
- Page 134 and 135: Box 8.4 The Badan Kredit Kecamatan:
- Page 136 and 137: Toward more liberal and open financ
- Page 138 and 139: a brief period firms faced rapid ch
- Page 140 and 141: Box 9.2 Financial reform in Korea K
- Page 142 and 143: In the next stage, financial reform
- Page 144 and 145: industry, policy reforms and the re
- Page 146 and 147: Conclusions of the Report challenge
- Page 148 and 149: tion "Risks and costs of finance" d
- Page 150 and 151: Montes-Negret, Fernando. "The Decli
- Page 152 and 153: D.C.: International Monetary Fund a
- Page 154 and 155: Harberger, Arnold C. 1985. "Lessons
- Page 156 and 157: croenterprises: Programs or Markets
- Page 158 and 159: Douglas Graham, and J. D. Von Pisch
- Page 160 and 161: Table A.2 Population and GNP per ca
- Page 162 and 163: Table A.5 GDP structure of producti
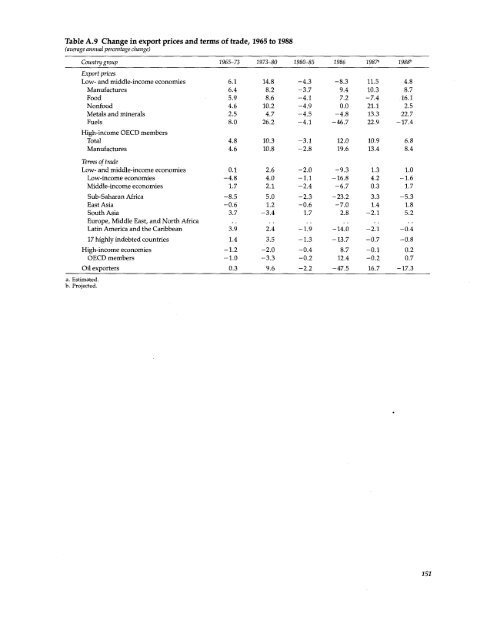
- Page 166 and 167: Table A.10 Growth of long-term debt
- Page 168 and 169: Table A.12 Composition of debt outs
- Page 170 and 171: Contents Key 157 Introduction and m
- Page 172 and 173: Introduction The World Development
- Page 174 and 175: Throughout the World Development In
- Page 176 and 177: Population _ 0-15 million The color
- Page 178 and 179: Table 1. Basic indicators __ GNP pe
- Page 180 and 181: Table 2. Growth of production______
- Page 182 and 183: Table 3. Structure of production __
- Page 184 and 185: Table 4. Agriculture and food Value
- Page 186 and 187: Table 5. Commercial energy ~~Energy
- Page 188 and 189: Table 6. Structure of manufacturing
- Page 190 and 191: Table 7. Manufacturing earnings and
- Page 192 and 193: Table 8. Growth of consumption and
- Page 194 and 195: Table 9. Structure of demand Distri
- Page 196 and 197: Table 10. Structure of consumption_
- Page 198 and 199: Table 11. Central government expend
- Page 200 and 201: Table 12. Central government curren
- Page 202 and 203: Table 13. Money and interest rates
- Page 204 and 205: Table 14. Growth of merchandise tra
- Page 206 and 207: Table 15. Structure of merchandise
- Page 208 and 209: Table 16. Structure of merchandise
- Page 210 and 211: Table 17. OECD imports of manufactu
- Page 212 and 213: Table 18. Balance of payments and r
- Page 214 and 215:
Table 19. Official development assi
- Page 216 and 217:
Table 20. Official development assi
- Page 218 and 219:
Table 21. Total external debt Long-
- Page 220 and 221:
Table 22. Flow of public and privat
- Page 222 and 223:
Table 23. Total external public and
- Page 224 and 225:
Table 24. External public debt and
- Page 226 and 227:
Table 25. Terms of external public
- Page 228 and 229:
Table 26. Population growth and pro
- Page 230 and 231:
Table 27. Demography and fertility
- Page 232 and 233:
Table 28. Health and nutrition popu
- Page 234 and 235:
Table 29. Education Percentage ofag
- Page 236 and 237:
Table 30. Income distribution and I
- Page 238 and 239:
Table 31. Urbanization Urban popula
- Page 240 and 241:
Table 32. Women in development_____
- Page 242 and 243:
Technical notes This twelfth editio
- Page 244 and 245:
Box A.1. Basic indicators for count
- Page 246 and 247:
Box A.2. Selected indicators for no
- Page 248 and 249:
from the Food and Agriculture Organ
- Page 250 and 251:
Exports of goods and nonfactor serv
- Page 252 and 253:
spectively. Since 1987 data are not
- Page 254 and 255:
The table reports the value of manu
- Page 256 and 257:
teed, and private nonguaranteed lon
- Page 258 and 259:
the Demographic and Health Surveys,
- Page 260 and 261:
also the one used within the global
- Page 262 and 263:
Bibliography Production and domesti
- Page 264 and 265:
Country classifications: World Deve
- Page 266:
I i


