

Financial systems and development
Financial systems and development
Financial systems and development

You also want an ePaper? Increase the reach of your titles
YUMPU automatically turns print PDFs into web optimized ePapers that Google loves.
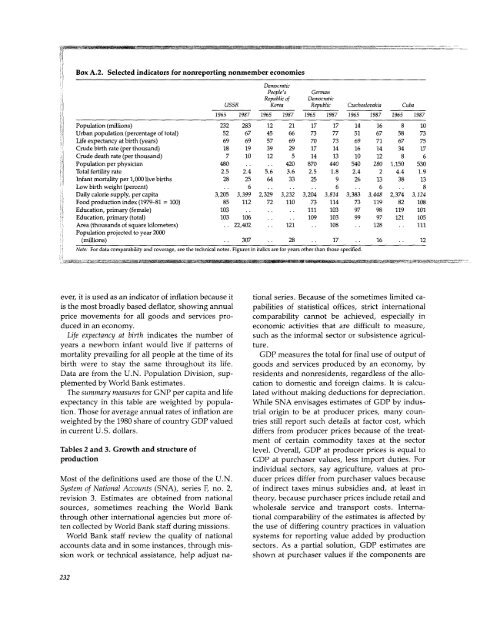
Box A.2. Selected indicators for nonreporting nonmember economies<br />
Democratic<br />
People's German<br />
Republic of Democratic<br />
USSR Korea Republic Czechoslovakia Cuba<br />
1965 1987 1965 1987 1965 1987 1965 1987 1965 1987<br />
Population (millions) 232 283 12 21 17 17 14 16 8 10<br />
Urban population (percentage of total) 52 67 45 66 73 77 51 67 58 73<br />
Life expectancy at birth (years) 69 69 57 69 70 73 69 71 67 75<br />
Crude birth rate (per thous<strong>and</strong>) 18 19 39 29 17 14 16 14 34 17<br />
Crude death rate (per thous<strong>and</strong>) 7 10 12 5 14 13 10 12 8 6<br />
Population per physician 480 .. .. 420 870 440 540 280 1,150 530<br />
Total fertility rate 2.5 2.4 5.6 3.6 2.5 1.8 2.4 2 4.4 1.9<br />
Infant mortality per 1,000 live births 28 25 64 33 25 9 26 13 38 13<br />
Low birth weight (percent) . 6 .. .. .. 6 .. 6 .. 8<br />
Daily calorie supply, per capita 3,205 3,399 2,329 3,232 3,204 3,814 3,383 3,448 2,374 3,124<br />
Food production index (1979-81 = 100) 85 112 72 110 73 114 73 119 82 108<br />
Education, primary (female) 103 .. .. . 111 103 97 98 119 101<br />
Education, primary (total) 103 106 .. .. 109 103 99 97 121 105<br />
Area (thous<strong>and</strong>s of square kilometers) . . 22,402 . . 121 108 . 128 111<br />
Population projected to year 2000<br />
(millions) 307 28 .. 17 .. 16 12<br />
Note: For data comparability <strong>and</strong> coverage, see the technical notes. Figures in italics are for years other than those specified.<br />
ever, it is used as an indicator of inflation because it tional series. Because of the sometimes limited cais<br />
the most broadly based deflator, showing annual pabilities of statistical offices, strict international<br />
price movements for all goods <strong>and</strong> services pro- comparability cannot be achieved, especially in<br />
duced in an economy. economic activities that are difficult to measure,<br />
Life expectancy at birth indicates the number of such as the informal sector or subsistence agriculyears<br />
a newborn infant would live if patterns of ture.<br />
mortality prevailing for all people at the time of its GDP measures the total for final use of output of<br />
birth were to stay the same throughout its life. goods <strong>and</strong> services produced by an economy, by<br />
Data are from the U.N. Population Division, sup- residents <strong>and</strong> nonresidents, regardless of the alloplemented<br />
by World Bank estimates. cation to domestic <strong>and</strong> foreign claims. It is calcu-<br />
The summary measures for GNP per capita <strong>and</strong> life lated without making deductions for depreciation.<br />
expectancy in this table are weighted by popula- While SNA envisages estimates of GDP by industion.<br />
Those for average annual rates of inflation are trial origin to be at producer prices, many counweighted<br />
by the 1980 share of country GDP valued tries still report such details at factor cost, which<br />
in current U.S. dollars. differs from producer prices because of the treatment<br />
of certain commodity taxes at the sector<br />
Tables 2 <strong>and</strong> 3. Growth <strong>and</strong> structure of level. Overall, GDP at producer prices is equal to<br />
production GDP at purchaser values, less import duties. For<br />
individual sectors, say agriculture, values at pro-<br />
Most of the definitions used are those of the U.N. ducer prices differ from purchaser values because<br />
System of National Accounts (SNA), series F, no. 2, of indirect taxes minus subsidies <strong>and</strong>, at least in<br />
revision 3. Estimates are obtained from national theory, because purchaser prices include retail <strong>and</strong><br />
sources, sometimes reaching the World Bank wholesale service <strong>and</strong> transport costs. Internathrough<br />
other international agencies but more of- tional comparability of the estimates is affected by<br />
ten collected by World Bank staff during missions. the use of differing country practices in valuation<br />
World Bank staff review the quality of national <strong>systems</strong> for reporting value added by production<br />
accounts data <strong>and</strong> in some instances, through mis- sectors. As a partial solution, GDP estimates are<br />
sion work or technical assistance, help adjust na- shown at purchaser values if the components are<br />
232


