

Financial systems and development
Financial systems and development
Financial systems and development

Create successful ePaper yourself
Turn your PDF publications into a flip-book with our unique Google optimized e-Paper software.
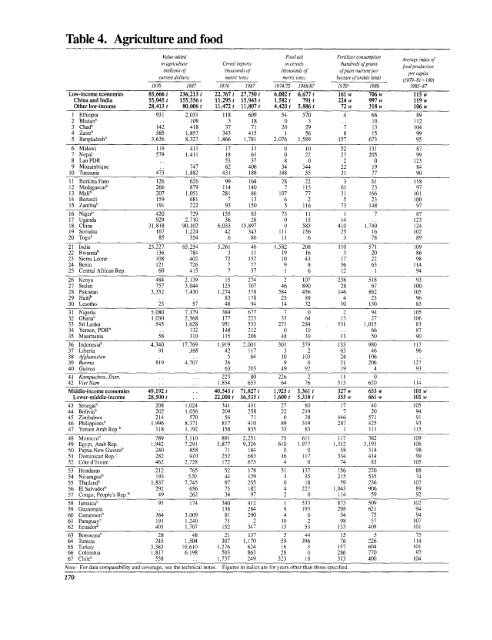
Table 4. Agriculture <strong>and</strong> food<br />
Value added Food aid FertiliZer consumption Average index of<br />
in agriculture<br />
Cereal imports in cereals (hundreds of grams food production<br />
(millions of<br />
(ihous<strong>and</strong>s of<br />
(thous<strong>and</strong>s of<br />
of plant nutrient per<br />
per capita<br />
current dollars) metric tons) metric tons) hectare of arable l<strong>and</strong>) (1979-81 = 100)<br />
1970 1987 1974 1987 1974/75 1986/87 1970' 1986 1985-87<br />
Low-incomeconomies 83,666 t 236,213 t 22,767 t 27,750 t 6,002 t 6,677 t 161 w 706 w 115 w<br />
China<strong>and</strong>lndia 55,045t 155,356t 11,295t 15,943t 1,582t 791t 224w 997w 119w<br />
Other low-income 28,413 t 80,006 t 11,472 t 11,807 t 4,420 t 5,886 t 72 w 318 w 106 w<br />
I Ethiopia 931 2,031 118 609 54 570 4 66 89<br />
2 Bhutan' .. 109 3 18 0 3 .. 10 112<br />
3 Chad' 142 418 37 71 20 29 7 13 104<br />
4 Zaire' 585 1,857 343 415 1 56 8 15 99<br />
5 Bangladesh' 3,636 8,327 1,866 1,781 2.076 1,589 157 673 95<br />
6 Malawi 119 411 17 11 0 10 52 131 87<br />
7 Nepal 579 1,411 18 61 0 22 27 205 99<br />
8 Lao PDR .. 53 37 8 0 2 0 123<br />
9 Mozambique 747 62 406 34 344 22 19 84<br />
10 Tanzania 473 1,882 431 188 148 55 31 77 90<br />
11 Burkina Faso 126 626 99 164 28 22 3 61 118<br />
12 Madagascar' 266 879 114 140 7 115 61 23 97<br />
13 Malib 207 1,051 281 86 107 77 31 166 101<br />
14 Burundi 159 681 7 13 6 2 5 23 100<br />
15 Zambia' 191 222 93 150 5 116 73 148 97<br />
16 Niger' 420 729 155 83 73 11 1 7 87<br />
17 Ug<strong>and</strong>a 929 2,710 36 26 0 15 14 123<br />
18 China 31,818 90,102 6,033 15,897 0 583 410 1,740 124<br />
19 Somalia 167 1,224 42 343 111 156 25 16 102<br />
20 Togo' 85 354 6 86 11 6 3 78 89<br />
21 India 23,227 65.254 5,261 46 1,582 208 110 571 109<br />
22 Rw<strong>and</strong>ab 136 784 3 11 19 16 3 20 86<br />
23 Sierra Leone 108 402 72 152 10 43 17 22 98<br />
24 Benin 121 726 7 77 9 8 36 63 114<br />
25 Central African Rep. 60 415 7 37 1 6 12 1 94<br />
26 Kenya 484 2,139 15 274 2 107 238 518 93<br />
27 Sudan 757 3,044 125 707 46 890 28 67 100<br />
28 Pakistan 3,352 7,430 1,274 378 584 456 146 862 105<br />
29 Haitib 83 178 25 89 4 23 96<br />
30 Lesotho 23 57 48 94 14 32 10 130 83<br />
31 Nigeria 5,080 7,379 389 677 7 0 2 94 105<br />
32 Ghana' 1,030 2,568 177 223 33 64 13 27 106<br />
33 SriLanka 545 1,628 951 533 271 234 531 1,015 83<br />
34 Yemen, PDR. 132 148 212 0 10 66 87<br />
35 Mauritania 58 310 115 206 48 30 11 50 90<br />
36 Indonesia' 4,340 17,769 1,919 2.001 301 379 133 980 117<br />
37 Liberia 91 368 42 117 3 2 63 46 96<br />
38 Afghanistan 5 64 10 11)3 24 106<br />
39 Burma 819 4,707 26 9 0 21 206 127<br />
40 Guinea .. .. 63 203 49 92 19 4 93<br />
41 Kampuchea, Dem. . . . 223 80 226 2 11 0<br />
42 VietNam .. 1,854 653 64 76 513 620 114<br />
Middle-incomeeconomies 49,192 t . . 40,543 t 71,827 t 1,925 t 5,361 t 327 w 653w 101 w<br />
Lower-middle-income 28,500 t . . 22,000 t 36,535 t 1,600 t 5,338 t 355 w 661 w 101 w<br />
43 Senegall 208 1,024 341 431 27 80 17 40 105<br />
44 Bolivia 0 202 1,056 209 258 22 219 7 20 94<br />
45 Zimbabwe 214 570 56 71 0 38 446 571 91<br />
46 Philippines, 1,996 8,371 817 910 89 349 287 425 93<br />
47 YemenArabRep. ' 118 1,192 158 835 33 83 1 111 115<br />
48 Morocco' 789 3,110 891 2,251 75 611 117 382 109<br />
49 Egypt, Arab Rep. 1,942 7,291 3,877 9,326 610 1.977 1.312 3,193 106<br />
50 PapuaNewGGuinea 0 240 858 71 184 0 0 58 314 98<br />
51 Dominican Rep. 0 282 910 252 683 16 117 334 414 99<br />
52 Cote d'lvoire 462 2,728 172 675 4 0 74 83 105<br />
53 Honduras 212 765 52 178 31 137 156 220 88<br />
54 Nicaragua' 193 570 44 129 3 35 215 535 74<br />
55 Thail<strong>and</strong> 0 1,837 7,745 97 255 0 18 59 236 107<br />
56 El Salvador ' 292 656 75 182 4 227 1.043 906 89<br />
57 Congo, People's Rep. ' 49 262 34 97 2 0 114 59 92<br />
58 Jamaica 0 93 174 340 412 1 333 873 509 102<br />
59 Guatemala .. .. 138 284 9 193 298 621 94<br />
60 Cameroon' 364 3.009 81 290 4 6 34 75 94<br />
61 Paraguayb 191 1,240 71 2 10 2 98 57 107<br />
62 Ecuador<br />
401 1,707 152 347 13 53 133 409 101<br />
63 Botswana' 28 48 21 137 5 44 15 5 75<br />
64 Tunisia 245 1,504 307 1,170 59 396 76 226 114<br />
65 Turkey 3,383 10,610 1,276 624 16 3 157 604 101<br />
66 Colombia 1,817 6,198 503 863 28 0 286 770 97<br />
67 Chile' 558 .. 1.737 249 323 18 313 400 104<br />
Note: For data comparability <strong>and</strong> coverage, see the technical notes.<br />
170<br />
Figures in italics are for years other than those specified.


