

Financial systems and development
Financial systems and development
Financial systems and development

Create successful ePaper yourself
Turn your PDF publications into a flip-book with our unique Google optimized e-Paper software.
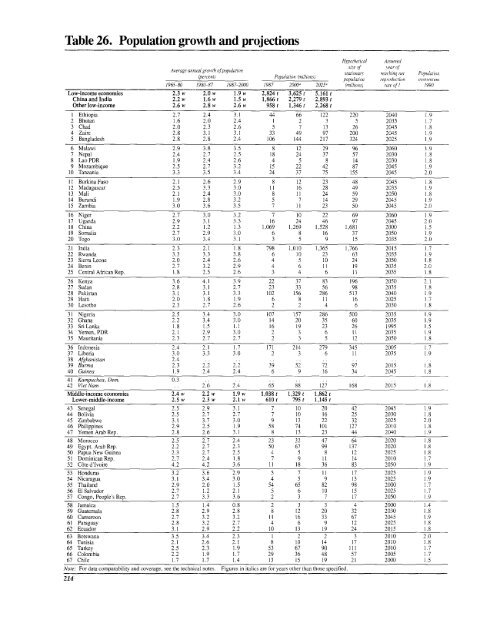
Table 26. Population growth <strong>and</strong> projections<br />
Hypothetical<br />
Assumed<br />
~~~~~~~~~~~~stationary<br />
Average anniual growth ofpopulation<br />
fpercetit)<br />
sie of<br />
reachingne<br />
\ear of<br />
Pouaoa<br />
(percent)<br />
Population (millions) populationr reproduction ototentuin<br />
1965 -80 1980 87 1987-2000 1987 2000 2025' (millions) rate of] 1990<br />
Low-income economies 2.3 w .. w 1.9 w 2,824t 3,625t 5,161 t<br />
China <strong>and</strong> India 2.2 w 1.6 w 1.5 w 1,866 t 2,279 t 2,893 t<br />
Other low-income 2.6 w 2.8 w 2.6 w 958 t 1,346 t 2,268 t<br />
I Ethiopia 2.7 2.4 3.1 44 66 122 220 2040 (.9<br />
2 Bhutan 1.6 2.0 2.4 1 2 3 5 2035 1.7<br />
3 Chad 2.0 2.3 2.6 5 7 13 26 2045 1.8<br />
4 Zaire 2.8 3.1 3.1 33 49 97 200 2045 1.9<br />
5 Bangladesh 2.8 2.8 2.4 106 144 217 324 2025 1.9<br />
6 Malawi 2.9 3.8 3.5 8 12 29 96 2060 1.9<br />
7 Nepal 2.4 2.7 2.5 18 24 37 57 2030 1.8<br />
8 Lao PDR 1.9 2.4 2.6 4 5 8 14 2030 1.8<br />
9 Mozambique 2.5 2.7 3.2 15 22 42 87 2045 1.9<br />
10 Tanzania 3.3 3.5 3.4 24 37 75 155 2045 2.0<br />
11 Burkina Faso 2.1 2.6 2.9 8 12 23 48 2045 1.8<br />
12 Madagascar 2.5 3.3 3.0 11 16 28 49 2035 1.9<br />
13 Mali 2.1 2.4 3.0 8 11 24 59 2050 1.8<br />
14 Burundi 1.9 2.8 3.2 5 7 14 29 2045 1.9<br />
15 Zambia 3.0 3.6 3.5 7 11 23 50 2045 2.0<br />
16 Niger 2.7 3.0 3.2 7 10 22 69 2060 1.9<br />
17 Ug<strong>and</strong>a 2.9 3.1 3.3 16 24 46 97 2045 2.0<br />
18 China 2.2 1.2 1.3 1,069 1,269 1.528 1,681 2000 1.5<br />
19 Somalia 2.7 2.9 3.0 6 8 16 37 2050 1.9<br />
20 Togo 3.0 3.4 3.1 3 5 9 15 2035 2.0<br />
21 India 2.3 2.1 1.8 798 1,010 1,365 1,766 2015 1.7<br />
22 Rw<strong>and</strong>a 3.3 3.3 3.8 6 10 23 63 2055 1.9<br />
23 Sierra Leone 2.0 2.4 2.6 4 5 10 24 2050 1.8<br />
24 Benin 2.7 3.2 2.9 4 6 11 19 2035 2.0<br />
25 Central African Rep. 1.8 2.5 2.6 3 4 6 11 2035 1.8<br />
26 Kenya 3.6 4.1 3.9 22 37 83 196 2050 2.1<br />
27 Sudan 2.8 3.1 2.7 23 33 56 98 2035 1.8<br />
28 Pakistan 3.1 3.1 3.3 102 156 286 513 2040 1.9<br />
29 Haiti 2.0 1.8 1.9 6 8 11 16 2025 1.7<br />
30 Lesotho 2.3 2.7 2.6 2 2 4 6 2030 1.8<br />
31 Nigeria 2.5 3.4 3.0 107 157 286 500 2035 1.9<br />
32 Ghana 2.2 3.4 3.0 14 20 35 60 2035 1.9<br />
33 SriLanka 1.8 1.5 1.1 16 19 23 26 1995 1.5<br />
34 Yemen, PDR 2.1 2.9 3.0 2 3 6 11 2035 1.9<br />
35 Mauritania 2.3 2.7 2.7 2 3 5 12 2050 1.8<br />
36 Indonesia 2.4 2.1 1.7 171 214 279 345 2005 1.7<br />
37 Liberia 3.0 3.3 3.0 2 3 6 11 2035 1.9<br />
38 Afghanistan 2.4 .. .. .. .. .. ..<br />
39 Burma 2.3 2.2 2.2 39 52 72 97 2015 (.8<br />
40 Guinea 1.9 2.4 2.4 6 9 (6 34 2045 1.8<br />
41 Kampuchea, Dem. 0.3 . . . .. . . . . .. ..<br />
42 VietNam .. 2.6 2.4 65 88 127 168 2015 1.8<br />
Middle-income econromies 2.4 w 2.2 w 1.9 w 1,038 t 1,329 t 1,862 t<br />
Lower-middle-income 2.5 w 2.3 w 2.1 w 610 t 795 t 1,145 t<br />
43 Senegal 2.5 2.9 3.1 7 10 20 42 2045 1.9<br />
44 Bolivia 2.5 2.7 2.7 7 10 16 25 2030 1.8<br />
45 Zimbabwe 3.1 3.7 3.0 9 13 22 32 2025 2.0<br />
46 Philippines 2.9 2.5 1.9 58 74 101 127 2010 1.8<br />
47 Yemen Arab Rep. 2.8 2.6 3,1 8 13 23 44 2040 1.9<br />
48 Morocco 2.5 2.7 2.4 23 32 47 64 2020 1.8<br />
49 Egypt, Arab Rep. 2.2 2.7 2.3 50 67 99 137 2020 1.8<br />
50 Papua New Guinea 2.3 2.7 2.5 4 5 8 12 2025 1.8<br />
51 DominicanRep. 2.7 2.4 1.8 7 9 11 14 2010 1.7<br />
52 Cote d'Ivoire 4.2 4.2 3.6 11 18 36 83 2050 1.9<br />
53 Honduras 3.2 3.6 2.9 5 7 11 17 2025 1.9<br />
54 Nicaragua 3.1 3.4 3.0 4 5 9 13 2025 1.9<br />
55 Thail<strong>and</strong> 2.9 2.0 1.5 54 65 82 98 2000 1.7<br />
56 ElSalvador 2.7 1.2 2.1 5 6 10 15 2025 i.7<br />
57 Congo, People's Rep. 2.7 3.3 3.6 2 3 7 17 2050 1.9<br />
58 Jamaica 1.5 1.4 0.8 2 3 3 4 2000 1.4<br />
59 Guatemala 2.8 2.9 2.8 8 12 20 32 2030 1.8<br />
60 Cameroon 2.7 3.2 3.2 11 16 33 67 2045 1.9<br />
61 Paraguay 2.8 3.2 2.7 4 6 9 12 2025 1.8<br />
62 Ecuador 3.1 2.9 2.2 10 13 19 24 2015 1.8<br />
63 Botswana 3.5 3.4 2.3 1 2 2 3 2010 2.0<br />
64 Tunisia 2.1 2.6 2.1 8 10 14 17 2010 1.8<br />
65 Turkey 2.5 2.3 1.9 53 67 90 III 2010 1.7<br />
66 Colombia 2.2 1.9 1.7 29 36 48 57 2005 1.7<br />
67 Chile 1.7 1.7 1.4 13 15 19 21 2000 1.5<br />
Note: For data comparability <strong>and</strong> coverage, see the technical notes. Figures in italics are for years other than those specified.<br />
214


