

Financial systems and development
Financial systems and development
Financial systems and development

Create successful ePaper yourself
Turn your PDF publications into a flip-book with our unique Google optimized e-Paper software.
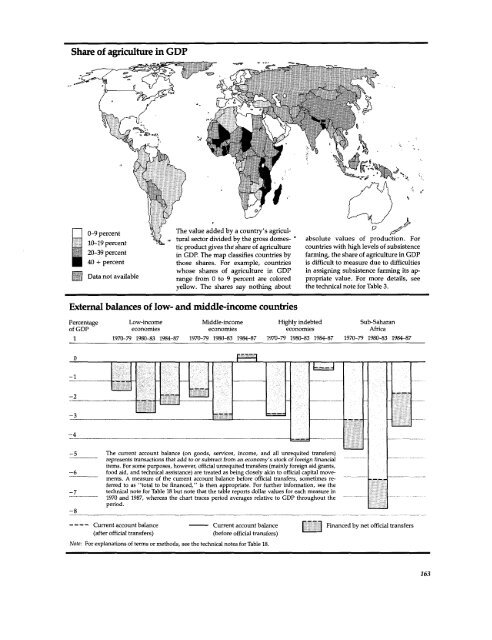
Share of agriculture in GDP<br />
_ 0-9 percent The value added by a country's agricul-<br />
10-19 percent ,, tural sector divided by the gross domes- absolute values of production. For<br />
[~j 10-19 percent tic product gives the share of agriculture countries with high levels of subsistence<br />
20-39 percent in GDP. The map classifies countries by farming, the share of agriculture in GDP<br />
40 + percent those shares. For example, countries is difficult to measure due to difficulties<br />
[7-= whose shares of agriculture in GDP in assigning subsistence farming its ap-<br />
Li Data not available range from 0 to 9 percent are colored propriate value. For more details, see<br />
yellow. The shares say nothing about the technical note for Table 3.<br />
External balances of low- <strong>and</strong> middle-income countries<br />
Percentage Low-income Middle-income Highly indebted Sub-Saharan<br />
of GDP economies economies economies Africa<br />
1 1970-79 1980-83 1984-87 1970-79 1980-83 1984-87 1970-79 1980-83 1984-87 1970-79 1980-83 1984-87<br />
0<br />
-2<br />
-3 __________I 1<br />
-4<br />
-5 The current account balance (on goods, services, income, <strong>and</strong> all unrequited transfers)<br />
represents transactions that add to or subtract from an economy's stock of foreign financial<br />
items. For some purposes, however, official unrequited transfers (mainly foreign aid grants,<br />
-6 food aid, <strong>and</strong> technical assistance) are treated as being dosely akin to official capital movements.<br />
A measure of the current account balance before official transfers, sometimes referred<br />
to as "total to be financed," is then appropriate. For further information, see the<br />
-7 technical note for Table 18 but note that the table reports dollar values for each measure in<br />
- 1970 <strong>and</strong> 1987, whereas the chart traces period averages relative to GDP throughout the<br />
period.<br />
-8<br />
- - - - Current account balance Current account balance r i1<br />
(after official transfers)<br />
(before official transfers)<br />
Note: For explanations of terms or methods, see the technical notes for Table 18.<br />
Financed by net official transfers<br />
163


