

Financial systems and development
Financial systems and development
Financial systems and development

Create successful ePaper yourself
Turn your PDF publications into a flip-book with our unique Google optimized e-Paper software.
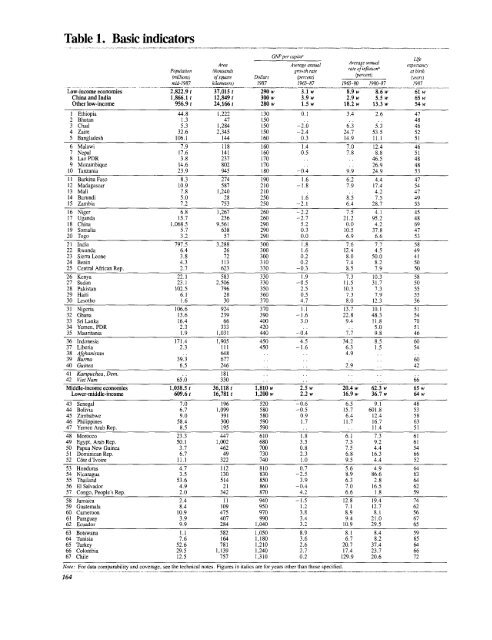
Table 1. Basic indicators __<br />
GNP per capital<br />
f<br />
Area<br />
Average annual Average annual expectancv<br />
Population (thous<strong>and</strong>s grow,th rate<br />
rate Of inflation' at birth<br />
(millions) ofsquare Dollars (percent) ~ ercent) (years)<br />
mid-1987 kilometers) 1987 1965-87 296.5-80 1980-87 1987<br />
Lo,w_-income ec'o'nomies 2,822.9 t 37,015 t 290 w 3.1 w 8.9 w 8.6 w 61 w<br />
China <strong>and</strong> India 1,866.1 t 12,849 t 300 w 3.9 w 2.9 w 5.5 w 65 w<br />
Other low-income 956.9 t 24,166 i 280 w 1.5 w 18.2 w 13.3 w 54 w<br />
I Ethiopia 44.8 1,222 130 0.1 3.4 2.6 47<br />
2 Bhuitan 1.3 47 150 ... 48<br />
3 Chad 5.3 1,284 150 -2.0 6.3 5.3 46<br />
4 Zaire 32.6 2,345 150 -2.4 24.7 53.5 52<br />
5 Banigladesh 106.1 144 160 0.3 14.9 11.1 51<br />
6 Malawi 7.9 118 160 1.4 7.0 12.4 46<br />
7 Nepal 17.6 141 160 0.5 7.8 8.8 51<br />
8 Lao PDR 3.8 237 170 . . 46.5 48<br />
9 Mozambique 14.6 802 170 . . 26.9 48<br />
10 Tanzania 23.9 945 180 -0.4 9.9 24.9 53<br />
I1I Burkina Faso 8.3 274 190 1.6 6.2 4.4 47<br />
12 Madagascar 10.9 587 210 -1.8 7.9 17.4 54<br />
13 Mali 7.8 1,240 210 . 4.2 47<br />
14 Bufundi 5.0 28 250 1.6 8.5 7.5 49<br />
15 Zamfbia 7.2 753 250 -2.1 6.4 28.7 53<br />
16 Niger 6.8 1,267 260 -2.2 7.5 4.1 45<br />
17 Ug<strong>and</strong>a 15.7 236 260 -2.7 21.2 95.2 48<br />
18 China 1,068.5 9,561 290 5.2 0.0 4.2 69<br />
19 Somalia 5.7 638 290 0.3 10.5 37.8 47<br />
20 Togo 3.2 57 290 0.0 6.9 6.6 53<br />
21 India 797.5 3,288 300 1.8 7.6 7.7 58<br />
22 Rw<strong>and</strong>a 6.4 26 300 1.6 12.4 4.5 49<br />
23 Sierra Leone 3.8 72 300 0.2 8.0 50.0 41<br />
24 Benin 4.3 113 310 0.2 7.4 8.2 50<br />
25 Central African Rep. 2.7 623 330 -0.3 8.5 7.9 50<br />
26 Kenya 22.1 583 330 1.9 7.3 10.3 58<br />
27 Sudan 23.1 2,506 330 -0.5 11.5 31.7 50<br />
28 Pakistan 102.5 796 350 2.5 10.3 7.3 55<br />
29 Haiti 6.1 28 360 0.5 7.3 7.9 55<br />
30 Lesotho 1.6 30 370 4.7 8.0 12.3 56<br />
31 Nigeria 106.6 924 370 1.1 13.7 10.1 51<br />
32 Ghana 13.6 239 390 - 1.6 22.8 48.3 54<br />
33 Sri Lanka 16.4 66 400 3.0 9.4 11.8 70<br />
34 Yemnen, PDR 2.3 333 420 . 5.0 51<br />
35 Mauritania 1.9 1,031 440 -0.4 7.7 9.8 46<br />
36 Indonesia 171.4 1,905 450 4.5 34.2 8.5 60<br />
37 Liberia 2.3 III 450 - 1.6 6.3 1.5 54<br />
38 Afghanistan .. 648 . 4.9<br />
39 Burma 39.3 677 ... .60<br />
40 Guinea 6.5 246 . 2.9 . 42<br />
41 Kampuchea,Dem. . 181 ..... .<br />
42 Viet Nam 65.0 330 . .. 66<br />
Middle-incomeconomies 1,038.5 t 36,118 t 1,810 w 2.5 w 20.4 w 62.3 w 65 w<br />
Lower-middle-income 609.6 t 16,781 t 1,200 w 2.2 w 16.9 w 36.7 w 64 w<br />
43 Senegal 7.0 196 520 -0.6 6.5 9.1 48<br />
44 Bolivia 6.7 1,099 580 -0.5 15.7 601.8 53<br />
45 Zimbahwe 9.0 391 580 0.9 6.4 12.4 58<br />
46 Philippines 58.4 300 590 1.7 11.7 16.7 63<br />
47 Yemen Arab Rep. 8.5 195 590 . . 11.4 51<br />
48 Morocco 23.3 447 610 1.8 6.1 7.3 61<br />
49 Egypt, Arab Rep. 50.1 1,002 680 3.5 7.3 9.2 61<br />
50 Papua New Guine-a 3.7 462 700 0.8 7.5 4.4 54<br />
51 Dominican Rep. 6.7 49 730 2.3 6.8 16.3 66<br />
52 C6tedIlvoire 11.1 322 740 1.0 9.5 4.4 52<br />
53 Honduras 4.7 112 810 0.7 5.6 4.9 64<br />
54 Nicaragua 3.5 130 830 -2.5 8.9 86.6 63<br />
55 Thail<strong>and</strong> 53.6 514 850 3.9 6.3 2.8 64<br />
56 El Salvador 4.9 21 860 -0.4 7.0 16.5 62<br />
57 Congo, People's Rep. 2.0 342 870 4.2 6.6 1.8 59<br />
58 Jamaica 2.4 11 940 -1.5 12.8 19.4 74<br />
59 Guatemala 8.4 109 950 1.2 7.1 12.7 62<br />
60 Catseroon 10.9 475 970 3.8 8.9 8.1 56<br />
61 Paraguay 3.9 407 990 3.4 9.4 21.0 67<br />
62 Ecuador 9.9 284 1,040 3.2 10.9 29.5 65<br />
63 Botswana 1.1 582 1L050 8.9 8. 1 8.4 59<br />
64 Tunisia 7.6 164 1,180 3.6 6.7 8.2 65<br />
65 Turkey 52.6 781 1,210 2.6 20.7 37.4 64<br />
66 Colombia 29.5 1,139 1,240 2.7 17.4 23.7 66<br />
67 Chile 12.5 757 1,310 0.2 129.9 20.6 72<br />
Note: For data comparability <strong>and</strong> coverage, see the technical notes. Figures in italics are for years other than those specified.<br />
164


