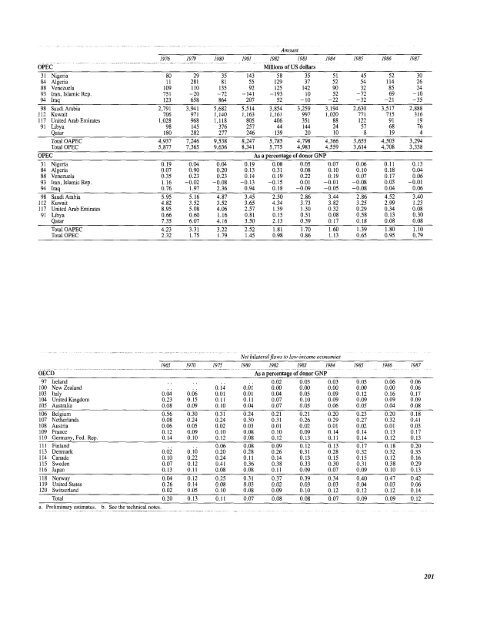
Table 19. Official <strong>development</strong> assistance from OECD & OPEC members 1965 1970 1975 1980 1983 1984 1985 1986 1987 1988, OECD Millions of US dollars 97 Irel<strong>and</strong> 0 0 8 30 33 35 39 62 51 57 100 New Zeal<strong>and</strong> . 14 66 72 61 55 54 75 87 104 103 Italy 60 147 182 683 834 1,133 1,098 2.404 2,615 104 United Kingdom 472 500 904 1,854 1,610 1,429 1,530 1,737 1,865 2,615 105 Australia 119 212 552 667 753 777 749 752 627 1,091 106 Belgium 102 120 378 595 479 446 440 547 689 592 107 Netherl<strong>and</strong>s 70 196 608 1,630 1,195 1,268 1,136 1,740 2,094 2,231 108 Austria 10 11 79 178 158 181 248 198 196 302 109 France 752 971 2,093 4,162 3,815 3,788 3.995 5,105 6,525 6,959 110 Germany, Fed. Rep. 456 599 1,689 3,567 3,176 2,782 2,942 3,832 4,391 4,700 111 Finl<strong>and</strong> 2 7 48 110 153 178 211 313 433 610 113 Denmark 13 59 205 481 395 449 440 695 859 922 114 Canada 96 337 880 1,075 1,429 1,625 1,631 1,695 1,885 2,340 115 Sweden 38 117 566 962 754 741 840 1,090 1,337 1,534 116 Japan 244 458 1,148 3,353 3,761 4,319 3,797 5,634 7,454 118 Norway 11 37 184 486 584 540 574 798 890 988 119 United States 4,023 3,153 4,161 7,138 8,081 8,711 9,403 9,564 8,945 12,170 120 Switzerl<strong>and</strong> 12 30 104 253 320 285 302 422 547 615 Total 6,480 6,968 13,847 27,297 27,592 28,742 29,429 36,663 41,531 49.730 OECD As a percentage of donor GNP 97 Irel<strong>and</strong> 0.00 0.00 0.09 0.16 0.20 0.22 0.24 0.28 0.28 0.20 100 New Zeal<strong>and</strong> . . 0.23 0.52 0.33 0.28 0.25 0.25 0.30 0.26 0.27 103 Italy 0.10 0.16 0.11 0.15 0.20 0.28 0.26 0.40 0.35 104 United Kingdom 0.47 0.41 0.39 0.35 0.35 0.33 0.33 0.31 0.28 0.32 105 Australia 0.53 0.59 0.65 0.48 0.49 0.45 0.48 0.47 0.33 0.46 106 Belgium 0.60 0.46 0.59 0.50 0.59 0.58 0.55 0.48 0.49 0.39 107 Netherl<strong>and</strong>s 0.36 0.61 0.75 0.97 0.91 1.02 0.91 1.01 0.98 0.98 108 Austria 0.11 0.07 0.21 0.23 0.24 0.28 0.38 0.21 0.17 0.24 109 France 0.76 0.66 0.62 0.63 0.74 0.77 0.78 0.70 0.74 0.73 110 Germany, Fed. Rep. 0.40 0.32 0.40 0.44 0.48 0.45 0.47 0.43 0.39 0.39 111 Finl<strong>and</strong> 0.02 0.06 0.18 0.22 0.32 0.35 0.40 0.45 0.50 0.59 113 Denmark 0.13 0.38 0.58 0.74 0.73 0.85 0.80 0.89 0.88 0.89 114 Canada 0.19 0.41 0.54 0.43 0.45 0.50 0.49 0.48 0.47 0.50 115 Sweden 0.19 0.38 0.82 0.78 0.84 0.80 0.86 0.85 0.88 0.87 116 Japan 0.27 0.23 0.23 0.32 0.32 0.34 0.29 0.29 0.31 118 Norway 0.16 0.32 0.66 0.87 1.10 1.03 1.01 1.17 1.09 1.12 119 United States 0.58 0.32 0.27 0.27 0.24 0.24 0.24 0.23 0.20 0.25 120 Switzerl<strong>and</strong> 0.09 0.15 0.19 0.24 0.31 0.30 0.31 0.30 0.31 0.32 OECD National currencies 97 Irel<strong>and</strong> (millions of pounds) 0 0 4 15 26 32 37 46 34 100 New Zeal<strong>and</strong> (millions of dollars) .. 13 55 74 91 95 109 143 146 103 Italv (billions of lire) 38 92 119 585 1,267 1,991 2,097 3,578 3,389 104 UnitedKingdom(millionsofpounds) 169 208 409 798 1,062 1,070 1,180 1.194 1,151 105 Australia (millions ofdollars) 106 189 402 591 802 873 966 1,121 895 106 Belgium (millions of francs) 5,100 6,000 13,902 17,399 24,390 25,527 26,145 24,525 25,835 107 Netherl<strong>and</strong>s (millions ofguilders) 253 710 1,538 3,241 3,411 4,069 3,773 4,263 4,242 108 Austria (millions of schillings) 260 286 1,376 2,303 2.838 3,622 5,132 3,023 2,478 109 France(millionsoffrancs) 3,713 5,393 8,971 17,589 29,075 33,107 35,894 35,357 39,218 110 Germany, Fed. Rep. (millions of deutschemarks) 1,824 2,192 4,155 6,484 8,109 7,917 8,661 8,323 8,004 111 Finl<strong>and</strong> (millions of markkaa) 6 29 177 414 852 1,070 1,308 1,587 1,902 113 Denmark(millionsofkroner) 90 443 1,178 2,711 3,612 4,650 4,657 5,623 5,848 114 Canada(millionsofdollars) 104 353 895 1,257 1,761 2,104 2,227 2,354 2,493 115 Sweden (millions of kronor) 197 605 2,350 4,069 5,781 6,129 7,226 7,765 8,477 116 Japan (billions of yen) 88 165 341 760 893 1,026 749 950 1,078 118 Norway (millions of kroner) 79 264 962 2,400 4,261 4,407 4,946 5,901 5,998 119 United States (millions of dollars) 4,023 3,153 4,161 7,138 8,081 8,711 9,403 9,564 8,945 120 Switzerl<strong>and</strong> (millions of francs) 52 131 268 424 672 672 743 759 815 OECD Summary ODA(billionsofUSdollars, nominalprices) 6.48 6.97 13.86 27.30 27.59 28.74 29.43 36.66 41.53 49.73 ODA as percentage ofGNP 0.48 0.34 0.35 0.37 0.36 0.36 0.35 0.35 0.35 . ODA (billions of US dollars, constant 1980 prices) 20.90 18.34 22.00 27.30 27.87 29.03 29.14 30.55 30.76 . GNP (trillions of US dollars. nominal prices 1.35 2.04 3.96 7.39 7.70 8.03 8.49 10.39 12.02 . GDPdeflator' 0.31 0.38 0.63 0.99 0.99 0.99 1.01 1.35 . Amount 200
OPEC Amount 1976 1979 1980 /981 1982 1983 1984 1985 1986 1987 Millions of US dollars 31 Nigeria 80 29 35 143 58 35 51 45 52 30 84 Algeria 1I 281 81 55 129 37 52 54 114 26 88 Venezuela 109 110 135 92 125 142 90 32 85 24 93 Iran,IslamicRep. 751 -20 -72 -141 -193 10 52 -72 69 -10 94 Iraq 123 658 864 207 52 -10 -22 -32 -21 -35 98 Saudi Arabia 2,791 3,941 5,682 5,514 3,854 3,259 3,194 2,630 3,517 2,888 112 Kuwait 706 971 1,140 1,163 1,161 997 1,020 771 715 316 117 United Arab Emirates 1,028 968 1,118 805 406 351 88 122 91 19 91 Libya 98 145 376 257 44 144 24 57 68 76 Qatar 180 282 277 246 139 20 10 8 19 4 OPEC Total OAPEC 4,937 7,246 9,538 8,247 5,785 4,798 4,366 3,655 4,503 3,294 Total OPEC 5,877 7,365 9,636 8,341 5,775 4.983 4,559 3,614 4,708 3,338 As a percentage of donor GNP 31 Nigeria 0.19 0.04 0.04 0.19 0.08 0.05 0.07 0.06 0.11 0.13 84 Algeria 0.07 0.90 0.20 0.13 0.31 0.08 0.10 0.10 0.18 0.04 88 Venezuela 0.35 0.23 0.23 0.14 0.19 0.22 0.19 0.07 0.17 0.06 93 Iran, Islamic Rep. 1.16 -0.02 -0.08 -0.13 -0.15 0.01 -0.01 -0.08 0.03 -0.01 94 Iraq 0.76 1.97 2.36 0.94 0.18 -0.09 -0.05 -0.08 0.04 0.06 98 Saudi Arabia 5.95 5.16 4.87 3.45 2.50 2.86 3.44 2.86 4.52 3.40 112 Kuwait 4.82 3.52 3.52 3.65 4.34 3.73 3.82 3.25 2.99 1.23 117 United Arab Emirates 8.95 5.08 4.06 2.57 1.39 1.30 0.32 0.29 0.34 0.08 91 Libya 0.66 0.60 1.16 0.81 0.15 0.51 0.08 0.58 0.13 0.30 Qatar 7.35 6.07 4.16 3.50 2.13 0.39 0.17 0.18 0.08 0.08 TotalOAPEC 4.23 3.31 3.22 2.52 1.81 1.70 1.60 1.39 1.80 1.10 Total OPEC 2.32 1.75 1.79 1.45 0.98 0.86 1.13 0.65 0.95 0.79 Net bilateral flows to lowv-income economies 1965 1970 1975 1980 1982 1983 1984 1985 1986 1987 OECD As a percentage of donor GNP 97 Irel<strong>and</strong> .. .. .. .. 0.02 0.03 0.03 0.05 0.06 0.06 100 NewZeal<strong>and</strong> .. .. 0.14 0.01 0.00 0.00 0.00 0.00 0.00 0.06 103 Italy 0.04 0.06 0.01 0.01 0.04 0.05 0.09 0.12 0.16 0.17 104 United Kingdom 0.23 0.15 0.11 0.11 0.07 0.10 0.09 0.09 0.09 0.09 105 Australia 0.08 0.09 0.10 0.04 0.07 0.05 0.06 0.05 0.04 0.08 106 Belgium 0.56 0.30 0.31 0.24 0.21 0.21 0.20 0.23 0.20 0.18 107 Netherl<strong>and</strong>s 0.08 0.24 0.24 0.30 0.31 0.26 0.29 0.27 0.32 0.41 108 Austria 0.06 0.05 0.02 0.03 0.01 0.02 0.01 0.02 0.01 0.03 109 France 0.12 0.09 0.10 0.08 0.10 0.09 0.14 0.14 0.13 0.17 110 Germany,Fed.Rep. 0.14 0.10 0.12 0.08 0.12 0.13 0.11 0.14 0.12 0.13 Ill Finl<strong>and</strong> .. .. 0.06 0.08 0.09 0.12 0.13 0.17 0.18 0.20 113 Denmark 0.02 0.10 0.20 0.28 0.26 0.31 0.28 0.32 0.32 0.35 114 Canada 0.10 0.22 0.24 0.11 0.14 0.13 0.15 0.15 0.12 0.16 115 Sweden 0.07 0.12 0.41 0.36 0.38 0.33 0.30 0.31 0.38 0.29 116 Japan 0.13 0.11 0.08 0.08 0.11 0.09 0.07 0.09 0.10 0.13 118 Norway 0.04 0.12 0.25 0.31 0.37 0.39 0.34 0.40 0.47 0.42 119 United States 0.26 0.14 0.08 0.03 0.02 0.03 0.03 0.04 0.03 0.06 120 Switzerl<strong>and</strong> 0.02 0.05 0.10 0.08 0.09 0.10 0.12 0.12 0.12 0.14 Total 0.20 0.13 0.11 0.07 0.08 0.08 0.07 0.09 0.09 0.12 a. Preliminary estimates. b. See the technical notes. 201
- Page 1:
~~~~/ , -. \-E:-: - :: 0 0 - PUB768
- Page 4 and 5:
Oxford University Press NEW YORK OX
- Page 6 and 7:
countries' financial institutions i
- Page 8 and 9:
4 Financial sector issues in develo
- Page 10 and 11:
7.1 Shares of medium- and long-term
- Page 12 and 13:
* Fractional reserve banking. The p
- Page 14 and 15:
NTB Nontariff barrier * Growth rate
- Page 16 and 17:
and grew even faster in 1988 than i
- Page 18 and 19:
etter loan recovery procedures, mor
- Page 20 and 21:
l~ ~~~ ~ ~~~~~~~~~~~~~~~~~~~ ;:: ;
- Page 22 and 23:
The early years of the recovery wer
- Page 24 and 25:
Figure 1.4 Growth of export volume
- Page 26 and 27:
Figure 1.6 Saving and investment ra
- Page 28 and 29:
edly, in Argentina, Brazil, and Mex
- Page 30 and 31:
5~~~~ '~ ' S " ''t.*:'.: .:,0!3gft"
- Page 32 and 33:
Box 1.2 Debt concepts A variety of
- Page 34 and 35:
Table 1.1 Selected economic indicat
- Page 36 and 37:
Figure 1.8 Domestic and external li
- Page 38 and 39:
Box 1.3 Foreign equity investment E
- Page 40 and 41:
j Box 2.1 Life without money "Some
- Page 42 and 43:
other ways too. By imposing direct
- Page 44 and 45:
Box 2.2 Transaction costs and the s
- Page 46 and 47:
Box 2.3 Real interest rates and gro
- Page 48 and 49:
I Box 2.4 Swapping risk All economi
- Page 50 and 51:
Box 2.5 Deposit insurance Most high
- Page 52 and 53:
GOVERNMENT. As well as being regula
- Page 54 and 55:
and receivables, whereas developmen
- Page 56 and 57:
with the expansion of nonlocal trad
- Page 58 and 59:
over. Even so, bankers and industri
- Page 60 and 61:
Box 3.3 Financial swindles i Swindl
- Page 62 and 63:
Box 3.4 Financial underdevelopment
- Page 64 and 65:
Box 3.6 Universal banking One of th
- Page 66 and 67:
1960s. They speeded the internation
- Page 68 and 69:
4 Financial sector issues in develo
- Page 70 and 71:
Box 4.1 Directed credit in Turkey ,
- Page 72 and 73:
Box 4.2 Lending program for small e
- Page 74 and 75:
Box 4.4 The Botswana Development Co
- Page 76 and 77:
markets to finance their deficits,
- Page 78 and 79:
0~~~~~ = == X .. _- -- = -_ _ _ __
- Page 80 and 81:
Figure 4.3 Financial savings and th
- Page 82 and 83:
Box 4.8 Financial indexation in Bra
- Page 84 and 85:
Financial systems in distress Not s
- Page 86 and 87:
t !< 4> - !: e z u- >as uei- i.e_.S
- Page 88 and 89:
tem. They have succeeded in stemmin
- Page 90 and 91:
governments gave too little thought
- Page 92 and 93:
Box 5.4 The U.S. savings and loan c
- Page 94 and 95:
or take a step in the other directi
- Page 96 and 97:
have been even larger. The cost of
- Page 98 and 99:
~Foundations offinancial systems If
- Page 100 and 101:
(an issue closely related to the as
- Page 102 and 103:
several centuries. The spread of su
- Page 104 and 105:
Bankruptcy and reorganization monit
- Page 106 and 107:
Box 6.5 Elements of a bank supervis
- Page 108 and 109:
they attempted to discipline bank m
- Page 110 and 111:
Developing financial systems What s
- Page 112 and 113:
Figure 7.1 Shares of medium- and lo
- Page 114 and 115:
Box 7.3 The financial history of a
- Page 116 and 117:
Box 7.4 Housing finance The formal
- Page 118 and 119:
Box 7.5 Bank modernization: Indones
- Page 120 and 121:
DEVELOPMENT FINANCE INSTITUTIONS. T
- Page 122 and 123:
esources in government securities o
- Page 124 and 125:
strides in recent years in establis
- Page 126 and 127:
Issues in informal finance Small-sc
- Page 128 and 129:
Box 8.2 Rotating savings and credit
- Page 130 and 131:
original amount to the renter by th
- Page 132 and 133:
cooperatives' managers because it a
- Page 134 and 135:
Box 8.4 The Badan Kredit Kecamatan:
- Page 136 and 137:
Toward more liberal and open financ
- Page 138 and 139:
a brief period firms faced rapid ch
- Page 140 and 141:
Box 9.2 Financial reform in Korea K
- Page 142 and 143:
In the next stage, financial reform
- Page 144 and 145:
industry, policy reforms and the re
- Page 146 and 147:
Conclusions of the Report challenge
- Page 148 and 149:
tion "Risks and costs of finance" d
- Page 150 and 151:
Montes-Negret, Fernando. "The Decli
- Page 152 and 153:
D.C.: International Monetary Fund a
- Page 154 and 155:
Harberger, Arnold C. 1985. "Lessons
- Page 156 and 157:
croenterprises: Programs or Markets
- Page 158 and 159:
Douglas Graham, and J. D. Von Pisch
- Page 160 and 161:
Table A.2 Population and GNP per ca
- Page 162 and 163:
Table A.5 GDP structure of producti
- Page 164 and 165: Table A.8 Growth of export volume,
- Page 166 and 167: Table A.10 Growth of long-term debt
- Page 168 and 169: Table A.12 Composition of debt outs
- Page 170 and 171: Contents Key 157 Introduction and m
- Page 172 and 173: Introduction The World Development
- Page 174 and 175: Throughout the World Development In
- Page 176 and 177: Population _ 0-15 million The color
- Page 178 and 179: Table 1. Basic indicators __ GNP pe
- Page 180 and 181: Table 2. Growth of production______
- Page 182 and 183: Table 3. Structure of production __
- Page 184 and 185: Table 4. Agriculture and food Value
- Page 186 and 187: Table 5. Commercial energy ~~Energy
- Page 188 and 189: Table 6. Structure of manufacturing
- Page 190 and 191: Table 7. Manufacturing earnings and
- Page 192 and 193: Table 8. Growth of consumption and
- Page 194 and 195: Table 9. Structure of demand Distri
- Page 196 and 197: Table 10. Structure of consumption_
- Page 198 and 199: Table 11. Central government expend
- Page 200 and 201: Table 12. Central government curren
- Page 202 and 203: Table 13. Money and interest rates
- Page 204 and 205: Table 14. Growth of merchandise tra
- Page 206 and 207: Table 15. Structure of merchandise
- Page 208 and 209: Table 16. Structure of merchandise
- Page 210 and 211: Table 17. OECD imports of manufactu
- Page 212 and 213: Table 18. Balance of payments and r
- Page 216 and 217: Table 20. Official development assi
- Page 218 and 219: Table 21. Total external debt Long-
- Page 220 and 221: Table 22. Flow of public and privat
- Page 222 and 223: Table 23. Total external public and
- Page 224 and 225: Table 24. External public debt and
- Page 226 and 227: Table 25. Terms of external public
- Page 228 and 229: Table 26. Population growth and pro
- Page 230 and 231: Table 27. Demography and fertility
- Page 232 and 233: Table 28. Health and nutrition popu
- Page 234 and 235: Table 29. Education Percentage ofag
- Page 236 and 237: Table 30. Income distribution and I
- Page 238 and 239: Table 31. Urbanization Urban popula
- Page 240 and 241: Table 32. Women in development_____
- Page 242 and 243: Technical notes This twelfth editio
- Page 244 and 245: Box A.1. Basic indicators for count
- Page 246 and 247: Box A.2. Selected indicators for no
- Page 248 and 249: from the Food and Agriculture Organ
- Page 250 and 251: Exports of goods and nonfactor serv
- Page 252 and 253: spectively. Since 1987 data are not
- Page 254 and 255: The table reports the value of manu
- Page 256 and 257: teed, and private nonguaranteed lon
- Page 258 and 259: the Demographic and Health Surveys,
- Page 260 and 261: also the one used within the global
- Page 262 and 263: Bibliography Production and domesti
- Page 264 and 265:
Country classifications: World Deve
- Page 266:
I i