

Financial systems and development
Financial systems and development
Financial systems and development

You also want an ePaper? Increase the reach of your titles
YUMPU automatically turns print PDFs into web optimized ePapers that Google loves.
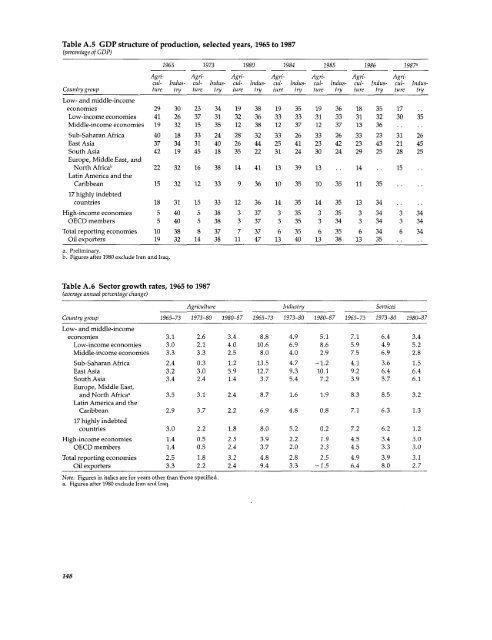
Table A.5 GDP structure of production, selected years, 1965 to 1987<br />
(percentage of GDP)<br />
1965 1973 1980 1984 1985 1986 1987a<br />
Agri- Agri- Agri- Agni- Agni- Agni- Agricul-<br />
Indus- cul- Indus- cul- Indus- cul- Indus- cul- Indus- cul- Indus- cul- Indus-<br />
Country group ture try ture try ture try ture try ture try ture try ture try<br />
Low- <strong>and</strong> middle-income<br />
economies 29 30 23 34 19 38 19 35 19 36 18 35 17<br />
Low-income economies 41 26 37 31 32 36 33 33 31 33 31 32 30 35<br />
Middle-income economies 19 32 15 35 12 38 12 37 12 37 13 36 .<br />
Sub-Saharan Africa 40 18 33 24 28 32 33 26 33 26 33 23 31 26<br />
East Asia 37 34 31 40 26 44 25 41 23 42 23 43 21 45<br />
South Asia 42 19 45 18 35 22 31 24 30 24 29 25 28 25<br />
Europe, Middle East, <strong>and</strong><br />
North Africab 22 32 16 38 14 41 13 39 13 . . 14 . 15<br />
Latin America <strong>and</strong> the<br />
Caribbean 15 32 12 33 9 36 10 35 10 35 11 35 .<br />
17 highly indebted<br />
countries 18 31 15 33 12 36 14 35 14 35 13 34<br />
High-income economies 5 40 5 38 3 37 3 35 3 35 3 34 3 34<br />
OECD members 5 40 5 38 3 37 3 35 3 34 3 34 3 34<br />
Total reporting economies 10 38 8 37 7 37 6 35 6 35 6 34 6 34<br />
Oil exporters 19 32 14 38 11 47 13 40 13 38 13 35 .<br />
a. Preliminary.<br />
b. Figures after 1980 exclude Iran <strong>and</strong> Iraq.<br />
Table A.6 Sector growth rates, 1965 to 1987<br />
(average annual percentage change)<br />
Agriculture Industry Services<br />
Countrygroup 1965-73 1973-80 1980-87 1965-73 1973-80 1980-87 1965-73 1973-80 1980-87<br />
Low- <strong>and</strong> middle-income<br />
economies 3.1 2.6 3.4 8.8 4.9 5.1 7.1 6.4 3.4<br />
Low-income economies 3.0 2.1 4.0 10.6 6.9 8.6 5.9 4.9 5.2<br />
Middle-income economies 3.3 3.3 2.5 8.0 4.0 2.9 7.5 6.9 2.8<br />
Sub-Saharan Africa 2.4 0.3 1.2 13.5 4.7 -1.2 4.1 3.6 1.5<br />
East Asia 3.2 3.0 5.9 12.7 9.3 10.1 9.2 6.4 6.4<br />
South Asia 3.4 2.4 1.4 3.7 5.4 7.2 3.9 5.7 6.1<br />
Europe, Middle East,<br />
<strong>and</strong> North Africa, 3.5 3.1 2.4 8.7 1.6 1.9 8.3 8.5 3.2<br />
Latin America <strong>and</strong> the<br />
Caribbean 2.9 3.7 2.2 6.9 4.8 0.8 7.1 6.3 1.3<br />
17 highly indebted<br />
countries 3.0 2.2 1.8 8.0 5.2 0.2 7.2 6.2 1.2<br />
High-income economies 1.4 0.5 2.5 3.9 2.2 1.9 4.5 3.4 3.0<br />
OECD members 1.4 0.5 2.4 3.7 2.0 2.3 4.5 3.3 3.0<br />
Total reporting economies 2.5 1.8 3.2 4.8 2.8 2.5 4.9 3.9 3.1<br />
Oil exporters 3.3 2.2 2.4 9.4 3.3 -1.5 6.4 8.0 2.7<br />
Note: Figures in italics are for years other than those specified.<br />
a. Figures after 1980 exclude Iran <strong>and</strong> Iraq.<br />
148


