

Financial systems and development
Financial systems and development
Financial systems and development

You also want an ePaper? Increase the reach of your titles
YUMPU automatically turns print PDFs into web optimized ePapers that Google loves.
Throughout the World Development Indicators,<br />
the data for China do not include Taiwan, China.<br />
However, footnotes to Tables 14-18 provide esti-<br />
mates of the international transactions for Taiwan,<br />
China.<br />
The table format of this edition follows that used<br />
in previous years. In each group, economies are<br />
listed in ascending order of GNP per capita, except<br />
those for which no such figure can be calculated.<br />
These are italicized <strong>and</strong> in alphabetical order at the<br />
end of the group deemed to be appropriate. This<br />
order is used in all tables except Table 19, which<br />
covers only OPEC <strong>and</strong> high-income OECD coun-<br />
tries. The alphabetical list in the key shows the<br />
reference nurnber for each economy; here, too,<br />
italics indicate economies with no estimates of<br />
GNP per capita. Economies in the high-income<br />
group marked by the symbol t are those classified<br />
Economies with populations of less than I million<br />
are not shown separately in the main tables,<br />
but basic indicators for these countries <strong>and</strong> territories<br />
are in a separate table in Box A.1.<br />
The summary measures are overall estimates:<br />
countries for which individual estimates are not<br />
shown, because of size, nonreporting, or insufficient<br />
history, have been included by assuming<br />
they follow the trend of reporting countries during<br />
such periods. This gives a more consistent aggregate<br />
measure by st<strong>and</strong>ardizing country coverage<br />
for each period shown. Group aggregates include<br />
countries with less than 1 million population, even<br />
though country-specific data for these countries do<br />
not appear in the tables. Where missing information<br />
accounts for a significant share of the overall<br />
estimate, however, the group measure is reported<br />
as not available.<br />
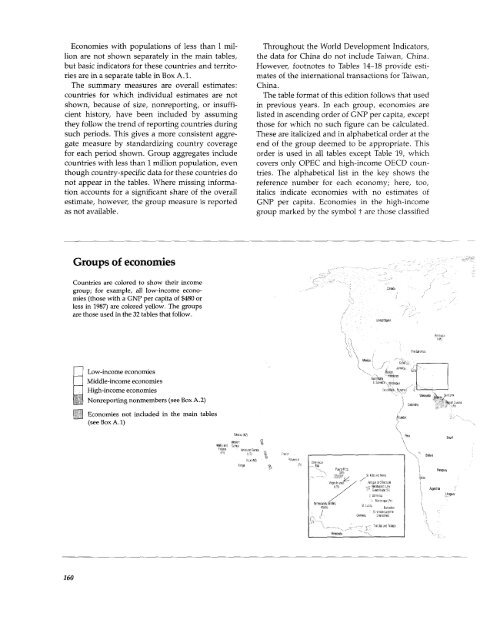
Groups of economies<br />
Countries are colored to show their income<br />
group; for example, all low-income economies<br />
(those with a GNP per capita of $480 or<br />
less in 1987) are colored yellow. The groups<br />
are those used in the 32 tables that follow.<br />
-Sa<br />
Middle'incor'eeconomis<br />
S<br />
Low-income economies U k eazie Ha d<br />
_i Middle-income economies E s ao D sr as,u<br />
High-income economies cO.-c Corona .<br />
Nonreporting nonmembers (see Box A.2) ,nb,<br />
)Mea,o.<br />
D Economies not included in the main tables<br />
(see Box A.1)<br />
res<br />
Vesle r<br />
i3a<br />
Fuluna Ameet Na,a NCI aSanoa .<br />
AFr) (9 r<br />
.,/ NZ) 'c 5nes a<br />
In~ ~~<br />
F.er^r D "> e~~~~ a ~ ~~~~~~~<br />
Den Rep,<br />
~~~. X5 Sea lKs3cN sthb Prg<br />
ViS n Is <strong>and</strong>s / Anta ardast V<br />
(L /s - M,,dsen ,5ndK<br />
/ X Dcn c V. ulLay<br />
1 0ess larsnrs,<br />
X : st v eens c5, arnNsdAee<br />
VSnezersa "\<br />
160


