

Financial systems and development
Financial systems and development
Financial systems and development

Create successful ePaper yourself
Turn your PDF publications into a flip-book with our unique Google optimized e-Paper software.
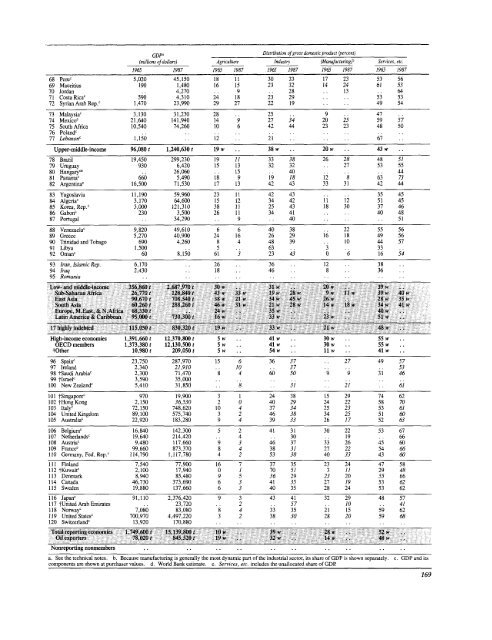
GDP'<br />
Distribution of gross domestic product (percent)<br />
(millions ofdollarsr) Agriculture Industry (Manufacturing)' Services, etc.<br />
1965 1987 196.5 1987 1965 1987 1965 1987 1965 1987<br />
68 eI 5,020 45,150 18 11 30 33 17 23 53 56<br />
69 Mauritius 190 1,480 16 15 23 32 14 24 61 53<br />
70 Jordan .. 4.270 9 . . 28 . 13 . . 64<br />
71Costa Rica' 590 4.310 24 18 23 29 53 53<br />
72 Syrian ArabRep.c 1,470 23.990 29 27 22 19 49 54<br />
73 Malaysia' 3,130 31,230 28 25 . 9 47<br />
74 Mexico' 21,640 141.940 14 9 27 34 20 25 59 57<br />
75 South Africu 10.540 74,260 10 6 42 44 23 23 48 50<br />
76 Pol<strong>and</strong>'<br />
77 Lebano'n' ~ 1,150 12 21 .. 67<br />
Upper-middle-income 96,080 t 1,240,630 t 19 w 38 w .. 20 w .. 43 w<br />
78 Beuzil 19,450 299.230 19 11 33 38 26 28 48 51<br />
79 Uruguay 930 6,420 15 13 32 32 ., 27 53 55<br />
80 Hungary' 26,060 .. 15 .. 40 - . 44<br />
81 Panuma' 660 5,490 18 9 19 18 12 8 63 73<br />
82 Argentinae 16,500 71,530 17 13 42 43 33 31 42 44<br />
83 Yugoslavia 11,190 59,960 23 11 42 43 .. .35 45<br />
84 Algeria' 3.170 64,600 15 12 34 42 11 12 51 45<br />
85 Korea, Rep.' 3,000 121,310 38 11 25 43 18 30 37 46<br />
86 Gabon' 230 3,500 26 11 34 41 .. 40 48<br />
87 Portugal . 34.290 . 9 . 40 . ... 51<br />
88 Venezuela' 9,820 49,610 6 6 40 38 22 55 56<br />
89 Greece 5.270 40,900 24 16 26 29 16 18 49 56<br />
90 Trinidad <strong>and</strong> Tobago 690 4,260 8 4 48 39 to 1 44 57<br />
91lLibya 1.500 .. 5 .63 .3 .. 33<br />
92 Oman' 60 8.150 61 3 23 43 0 6 16 54<br />
93 Iran, Islamic Rep. 6,170 . 26 .. 36 .. 12 .. 38<br />
94 Iraq 2,430 .. 18 .46 .. 8 .36<br />
95 Romnania.... . ... . ..<br />
Low- <strong>and</strong> middle-income 356,8601t 2,687,970 t 30 w .. 31 w .20 w ,39 w<br />
Sub-Sahsaran Africa 26,770 t 128,840t 43 w 33 w 19 w 28 w 9 w It w 39 w 40 w<br />
East Asia 90,670 t 708,540 t 38 w 21 w 34 w 45 w 26 w .. 28 w 35 w<br />
Soiuth Asia 60,260D 288,260 t 46 w 31 w 21 w 28 w 14 w 18 w 34 w 41 w<br />
Europe, M.East, &N.Africa 68,330r t 24 w .35 w ... .40 w<br />
Latin America &Caribbean 95,000 t 730,3001t 16 w .33 w .. 2w .51 w<br />
17bhighly indebted 115,050 t 830,320 t 19 w 1.33w -21 w .48 w<br />
High-incomeconomies 1,391,660 t 12,370,800 t 5 w .. 41 w .. 30 w .. 55 w<br />
OECD members 1,373,380 t 12,130,500 t 5 w . 41 w .. 30 w .. 55 w<br />
bOther 10,980 t 209,0501t 5w .54 w .11 w .41 w<br />
96 Spain' 23,750 287,970 15 6 36 37 .. 27 49 57<br />
97 Irel<strong>and</strong> 2,340 21,910 .. 10 . 37 . . 53<br />
98 tSaudi Arabiac 2,300 71,470 8 4 60 50 9 9 31 46<br />
99 tlsraelF 3,590 35,000 . ... .... ..<br />
100 New Zeal<strong>and</strong>' 5.410 31,850 . 8 . 31 . 21 . 61<br />
101 fSingaporel 970 19,900 3 1 24 38 15 29 74 62<br />
102 tHong Kong 2,150 36,530 2 0 40 29 24 22 58 70<br />
103 ltayl 72,150 748.620 10 4 37 34 25 23 53 61<br />
104 United Kingdom 89,100 575.740 3 2 46 38 34 25 51 60<br />
105 Australia' 22,920 183,280 9 4 39 33 26 17 52 63<br />
106 Belgium'c 16.840 142.300 5 2 41 31 30 22 53 67<br />
107 Netherl<strong>and</strong>s' 19.640 214,420 .. 4 . 30 - 19 . 66<br />
108 Austria' 9.480 117,660 9 3 46 37 33 26 45 60<br />
109 Franice 5 99.660 873,370 8 4 38 31 27 22 54 66<br />
110 Gemiany, Fed. Rep.' 114,790 1,117.780 4 2 53 38 40 33 43 60<br />
III Finl<strong>and</strong> 7,540 77,900 16 7 37 35 23 24 47 58<br />
5<br />
112 tKuwait<br />
2,100 17,940 0 1 70 51 3 11 29 48<br />
113 Denmark 8,940 85,480 9 5 36 29 23 20 55 66<br />
114 Caniada 46.730 373,690 6 3 41 35 27 19 53 62<br />
115 Sweden 19.880 137,660 6 3 40 35 28 24 53 62<br />
116 Japan' 91,110 2,376,420 9 3 43 41 32 29 48 57<br />
117 tUnited Arab Emirates 23,720 .. 2 .. 57 .. 10 .. 41<br />
118 Norwayc 7,080 83,080 8 4 33 35 21 15 59 62<br />
119 United Staten' 700.970 4,497.220 3 2 38 30 28 20 59 68<br />
120 Switzerl<strong>and</strong>' 13,920 170,880. ... ...<br />
Totalireporting econtomies 1,749,600 t 15,139,8001 t lOw .39 w * . 28 w .. 52w -<br />
(xi exporters 78,020 t 845,520 t 19 w .32 w .14 w .48 w<br />
Nonreporting nonmnembers . . . .. ..<br />
a. See the technical notes. b. Because manufacturing is generally the most dynamic part of the industrial sector,its share of GDPis shown separately. c. GDP <strong>and</strong>'its<br />
components are shown at purchaser values. d. Worid Bank estimate. e. Services, etc. includes the unallocated share of GDP.<br />
169


