

Financial systems and development
Financial systems and development
Financial systems and development

You also want an ePaper? Increase the reach of your titles
YUMPU automatically turns print PDFs into web optimized ePapers that Google loves.
Ii<br />
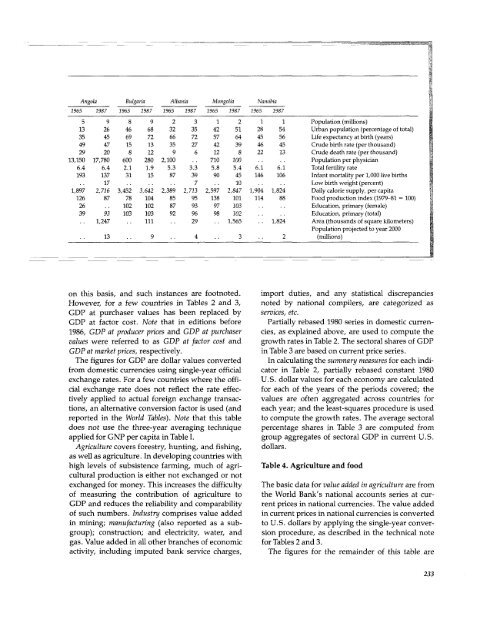
Angola Bulgaria Albania Mongolia Namibia<br />
1965 1987 1965 1987 1965 1987 1965 1987 1965 1987<br />
5 9 8 9 2 3 1 2 1 1 Population (millions)<br />
13 26 46 68 32 35 42 51 28 54 Urban population (percentage of total)<br />
35 45 69 72 66 72 57 64 45 56 Life expectancy at birth (years)<br />
49 47 15 13 35 27 42 39 46 45 Crude birth rate (per thous<strong>and</strong>)<br />
29 20 8 12 9 6 12 8 22 13 Crude death rate (per thous<strong>and</strong>)<br />
13,150 17,780 600 280 2,100 .. 710 100 .. .. Population per physician<br />
6.4 6.4 2.1 1.9 5.3 3.3 5.8 5.4 6.1 6.1 Total fertility rate<br />
193 137 31 15 87 39 90 45 146 106 Infant mortality per 1,000 live births<br />
17 .. .. .. 7 . . 10 .. .. Low birth weight (percent)<br />
1,897 2,716 3,452 3,642 2,389 2,713 2,597 2,847 1,904 1,824 Daily calorie supply, per capita<br />
126 87 78 104 85 95 138 101 114 88 Food production index (1979-81 = 100)<br />
26 . . 102 102 87 93 97 103 . . , Education, primary (female)<br />
39 93 103 103 92 96 98 102 .. .. Education, primary (total)<br />
1,247 .. 111 . . 29 . 1,565 . . 1,824 Area (thous<strong>and</strong>s of square kilometers)<br />
Population projected to year 2000<br />
13 .. 9 .. 4 .. 3 .. 2 (millions)<br />
on this basis, <strong>and</strong> such instances are footnoted. import duties, <strong>and</strong> any statistical discrepancies<br />
However, for a few countries in Tables 2 <strong>and</strong> 3, noted by national compilers, are categorized as<br />
GDP at purchaser values has been replaced by services, etc.<br />
GDP at factor cost. Note that in editions before Partially rebased 1980 series in domestic curren-<br />
1986, GDP at producer prices <strong>and</strong> GDP at purchaser cies, as explained above, are used to compute the<br />
values were referred to as GDP at factor cost <strong>and</strong> growth rates in Table 2. The sectoral shares of GDP<br />
GDP at market prices, respectively.<br />
in Table 3 are based on current price series.<br />
The figures for GDP are dollar values converted In calculating the summary measures for each indifrom<br />
domestic currencies using single-year official cator in Table 2, partially rebased constant 1980<br />
exchange rates. For a few countries where the offi- U.S. dollar values for each economy are calculated<br />
cial exchange rate does not reflect the rate effec- for each of the years of the periods covered; the<br />
tively applied to actual foreign exchange transac- values are often aggregated across countries for<br />
tions, an alternative conversion factor is used (<strong>and</strong> each year; <strong>and</strong> the least-squares procedure is used<br />
reported in the World Tables). Note that this table to compute the growth rates. The average sectoral<br />
does not use the three-year averaging technique percentage shares in Table 3 are computed from<br />
applied for GNP per capita in Table 1. group aggregates of sectoral GDP in current U.S.<br />
Agriculture covers forestry, hunting, <strong>and</strong> fishing, dollars.<br />
as well as agriculture. In developing countries with<br />
high levels of subsistence farming, much of agri- Table 4. Agriculture <strong>and</strong> food<br />
cultural production is either not exchanged or not<br />
exchanged for money. This increases the difficulty The basic data for value added in agriculture are from<br />
of measuring the contribution of agriculture to the World Bank's national accounts series at cur-<br />
GDP <strong>and</strong> reduces the reliability <strong>and</strong> comparability rent prices in national currencies. The value added<br />
of such numbers. Industry comprises value added in current prices in national currencies is converted<br />
in mining; manufacturing (also reported as a sub- to U.S. dollars by applying the single-year convergroup);<br />
construction; <strong>and</strong> electricity, water, <strong>and</strong> sion procedure, as described in the technical note<br />
gas. Value added in all other branches of economic for Tables 2 <strong>and</strong> 3.<br />
activity, including imputed bank service charges, The figures for the remainder of this table are<br />
233


