

Financial systems and development
Financial systems and development
Financial systems and development

You also want an ePaper? Increase the reach of your titles
YUMPU automatically turns print PDFs into web optimized ePapers that Google loves.
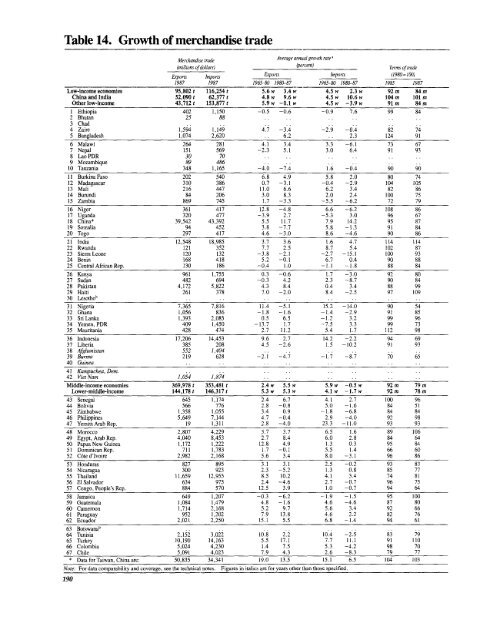
Table 14. Growth of merch<strong>and</strong>ise trade<br />
Merch<strong>and</strong>ise trade<br />
Average annual growth rate a<br />
(millions ofdollars) (percent) Terms oftrade<br />
Exports lmports Exports Imports (1980=100)<br />
1987 1987 1965-80 1980-87 1965-80 1980-87 1985 1987<br />
Low-incomeconomies<br />
China <strong>and</strong> India<br />
95,802 t<br />
52,090 t<br />
116,254 t<br />
62,377 t<br />
5.6 w<br />
4.8 w<br />
3.4 w<br />
9.6 w<br />
4.5 w<br />
4.5 w<br />
2.3 w<br />
10.6 w<br />
92 m<br />
104 m<br />
84 m<br />
101 m<br />
Other low-income 43,712 t 153,877 t 5.9 w -0.1 w 4.5 w -3.9 w 91 m 84 m<br />
I Ethiopia 402 1,150 -0.5 -0.6 -0.9<br />
2 Bhutan 25 88 .. . .<br />
7.6 99 84<br />
3 Chad<br />
4 Zaire 1,594 1,149 4.7 -3.4 -2.9 -0.4 82 74<br />
5 Bangladesh 1,074 2,620 .. 6.2 . . 2.3 124 91<br />
6 Malawi 264 281 4.1 3.4 3.3 -6.1 73 67<br />
7 Nepal 151 569 -2.3 5.A 3.0 6.4 91 93<br />
8 Lao PDR 30 70 .. .. ..<br />
9 Mozambique 89 486 .. .. .. ..<br />
10 Tanzania 348 1,165 -4.0 -7.4 1.6 -0.4 90 90<br />
11 Burkina Faso 202 540 6.8 4.9 5.8 2.0 80 74<br />
12 Madagascar 310 386 0.7 -3.1 -0.4 -2.9 104 105<br />
13 Mali 216 447 11.0 6.6 6.2 3.4 82 86<br />
14 Bunindi 84 206 3.0 8.3 2.0 2.4 100 75<br />
15 Zambia 869 745 1.7 -3.3 -5.5 -6.2 72 79<br />
16 Niger 361 417 12.8 -4.8 6.6 -6.2 108 86<br />
17 Ug<strong>and</strong>a 320 477 -3.9 2.7 -5.3 3.0 96 67<br />
18 China* 39,542 43,392 5.5 11.7 7.9 14.2 95 87<br />
19 Somalia 94 452 3.8 -7.7 5.8 -1.3 91 84<br />
20 Togo 297 417 4.6 -3.0 8.6 -4.6 90 86<br />
21 India 12,548 18,985 3.7 3.6 1.6 4.7 114 114<br />
22 Rw<strong>and</strong>a 121 352 7.7 2.5 8.7 5.4 102 87<br />
23 SierraLeone 120 132 -3.8 -2.1 -2.7 -15.1 100 93<br />
24 Benin 168 418 5.2 -0.1 6.7 0.4 90 88<br />
25 CentralAfricanRep. 130 186 -0.4 1.0 -1.1 -1.8 88 84<br />
26 Kenya 961 1,755 0.3 -0.6 1.7 -3.0 92 80<br />
27 Sudan 482 694 -0.3 4.2 2.3 -8.7 90 84<br />
28 Pakistan 4,172 5,822 4.3 8.4 0.4 3.4 88 99<br />
29 Haiti 261 378 7.0 -2.0 8.4 -2.5 97 109<br />
30 Lesotho' .. .. .. .. .. .. .<br />
31 Nigeria 7,365 7,816 11.4 -5.1 15.2 -14.0 90 54<br />
32 Ghana 1,056 836 -1.8 -1.6 -1.4 -2.9 91 85<br />
33 SriLanka 1,393 2,085 0.5 6.5 -1.2 3.2 99 96<br />
34 Yemen, PDR 409 1,450 -13.7 1.7 -7.5 3.3 99 73<br />
35 Mauritania 428 474 2.7 11.2 5.4 1.7 112 98<br />
36 Indonesia 17,206 14,453 9.6 2.7 14.2 -2.2 94 69<br />
37 Liberia 385 208 4.5 -2.6 1.5 -10.2 91 93<br />
38 Afghanistan 552 1,404 .. .. .. ..<br />
39 Burma 219 628 -2.1 -4.7 -1.7 -8.7 70 65<br />
40 Guinea .. .. .. .. .. .. .<br />
41 Kampuchea, Dem. .. .. .. .. .. ..<br />
42 Viet Nam 1,054 1,874 .. .. .. .. .<br />
Middle-income economies<br />
Lower-middle-income<br />
369,978 t<br />
144,178 t<br />
353,481 t<br />
146,317 t<br />
2.4 w<br />
5.3 w<br />
5.5 w<br />
5.3 w<br />
5.9 w -0.5 w<br />
4.1 w -1.7 w<br />
92 m<br />
92 m<br />
79 m<br />
78 m<br />
43 Senegal 645 1,174 2.4 6.7 4.1 2.7 100 96<br />
44 Bolivia 566 776 2.8 -0.8 5.0 -1.6 84 51<br />
45 Zimbabwe 1,358 1,055 3.4 0.9 -1.8 -6.8 84 84<br />
46 Philippines 5,649 7,144 4.7 -0.4 2.9 -4.0 92 98<br />
47 YemenArabRep. 19 1,311 2.8 -4.0 23.3 -11.0 93 93<br />
48 Morocco 2,807 4,229 3.7 3.7 6.5 1.6 89 106<br />
49 Egypt, Arab Rep. 4,040 8,453 2.7 8.4 6.0 2.8 84 64<br />
50 PapuaNew Guinea 1,172 1,222 12.8 4.9 1.3 0.3 95 84<br />
51 DominicanRep. 711 1,783 1.7 -0.1 5.5 1.4 66 60<br />
52 C6te d'lvoire 2,982 2,168 5.6 3.4 8.0 -3.1 96 86<br />
53 Honduras 827 895 3.1 3.1 2.5 -0.2 93 83<br />
54 Nicaragua 300 923 2.3 -5.2 1.3 0.8 85 77<br />
55 Thail<strong>and</strong> 11,659 12,955 8.5 10.2 4.1 3.4 74 81<br />
56 El Salvador 634 975 2.4 -4.6 2.7 -0.7 96 75<br />
57 Congo, People's Rep. 884 570 12.5 3.9 1.0 -0.7 94 64<br />
58 Jamaica 649 1,207 -0.3 -6.2 -1.9 -1.5 95 100<br />
59 Guatemala 1,084 1,479 4.8 -1.6 4.6 -4.6 87 80<br />
60 Cameroon 1,714 2,168 5.2 9.7 5.6 3.4 92 66<br />
61 Paraguay 952 1,202 7.9 13.8 4.6 2.2 82 76<br />
62 Ecuador 2,021 2,250 15.1 5.5 6.8 -1.4 94 61<br />
63 Botswana' .. .. .. .. .. .. .<br />
64 Tunisia 2,152 3,022 10.8 2.2 10.4 -2.5 83 79<br />
65 Turkey 10,190 14,163 5.5 17.1 7.7 11.1 91 110<br />
66 Colombia 5,024 4,230 1.4 7.5 5.3 -4.2 98 70<br />
67 Chile 5,091 4,023 7.9 4.3 2.6 -8.3 79 77<br />
* Data forTaiwan, China are: 50,835 34,341 19.0 13.5 15.1 6.5 104 103<br />
Note: For data comparability <strong>and</strong> coverage, see the technical notes.<br />
190<br />
Figures in italics are for years other than those specified.


