

Financial systems and development
Financial systems and development
Financial systems and development

You also want an ePaper? Increase the reach of your titles
YUMPU automatically turns print PDFs into web optimized ePapers that Google loves.
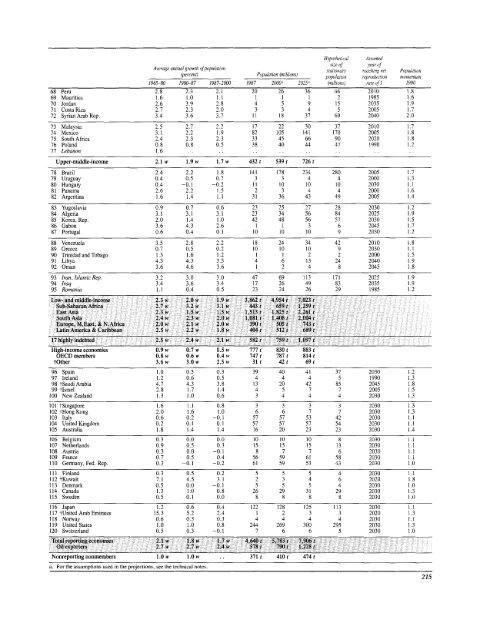
Hypothetical<br />
Assumed<br />
Average annual growth of population stationao reachrg net Populotion<br />
(percent)<br />
Population (millionsJ population reproduction momentunt<br />
1965-80 1980-87 1987-2000 1987 2000, 2025' (millionsc) rate of 1 1990<br />
68 Peru 2.8 2.3 2.1 20 26 36 46 2010 1.8<br />
69 Mauritius 1.6 1.0 1.1 1 1 1 2 1985 1.6<br />
70 Jordan 2.6 3.9 2.8 4 5 9 15 2035 1.9<br />
71 Costa Rica 2.7 2.3 2.0 3 3 4 5 2005 1.7<br />
72 SyrianArabRep. 3.4 3.6 3.7 1] 18 37 69 2040 2.0<br />
73 Malaysia 2.5 2.7 2.2 17 22 30 37 2010 1.7<br />
74 Mexico 3.1 2.2 1.9 82 105 141 170 2005 1.8<br />
75 South Africa 2.4 2.3 2.3 33 45 66 90 2020 1.8<br />
76 Pol<strong>and</strong> 0.8 0.8 0.5 38 40 44 47 1990 1.2<br />
77 Lebanon 1.6 .. .. .. .. .. ..<br />
Upper-middle-income 2.1 w 1.9 w 1.7 w 432 t 539 t 726 t<br />
78 Brazil 2.4 2.2 1.8 141 178 234 280 2005 1.7<br />
79 Uruguay 0.4 0.5 0.7 3 3 4 4 2000 1.3<br />
80 Hungaiy 0.4 -0.1 -0.2 11 10 10 10 2030 1.1<br />
81 Panama 2.6 2.2 1.5 2 3 4 4 2000 1.6<br />
82 Argentina 1.6 1.4 1.1 31 36 43 49 2005 1.4<br />
83 Yugoslavia 0.9 0.7 0.6 23 25 27 28 2030 1.2<br />
84 Algeria 3.1 3.1 3.1 23 34 56 84 2025 1.9<br />
85 Korea, Rep. 2.0 1.4 1.0 42 48 56 57 2030 1.5<br />
86 Gabon 3.6 4.3 2.6 1 1 3 6 2045 1.7<br />
87 Portugal 0.6 0.4 0.1 10 10 10 9 2030 1.2<br />
88 Venezuela 3.5 2.8 2.2 18 24 34 42 2010 1.8<br />
89 Greece 0.7 0.5 0.2 10 10 10 9 2030 1.1<br />
90 Trinidad <strong>and</strong> Tobago 1.3 1.6 1.2 1 1 2 2 2000 1.5<br />
91 Libya 4.3 4.3 3.5 4 6 13 24 2040 1.9<br />
92 Oman 3.6 4.6 3.6 1 2 4 8 2045 1.8<br />
93 Iran, IslamicRep. 3.2 3.0 3.0 47 69 113 171 2025 1.9<br />
94 Iraq 3.4 3.6 3.4 17 26 49 83 2035 1.9<br />
95 Romania 1.1 0.4 0.5 23 24 26 29 1985 1.2<br />
Low- <strong>and</strong> middle-income 2.3 w 2.0 w 1.9 w 3,862 t 4,954 t 7,023 t<br />
Sub-SaharanAfrica 2.7 w 3.2 w 3.1 w 443 t 659 t 1,259 t<br />
East Asia 2.3 w 1.5 w 1.5 w 1,513 t 1,825 t 2,261 t<br />
South Asia 2.4 w 2.3 w 2.0 w 1,081 t 1,408 t 2,004 t<br />
Europe, M.East, & N.Africa 2.0 w 2.1 w 2.0 w 390 t 505 t 743 t<br />
Latin America & Caribbean 2.5 w 2.2 w 1.8 w 404 t 512 t 689 t<br />
17 highly indebted 2.5 w 2.4 w 2.1 w 582 t 759 t 1,097 t<br />
High-income economies 0.9 w 0.7 w 0.5 w 777 t 830 t 883 t<br />
OECD members 0.8 w 0.6 w 0.4 w 747 t 787 t 814 t<br />
tOther 3.6w 3.0w 2.5 w 31 t 42 t 69 t<br />
96 Spain 1.0 0.5 0.3 39 40 41 37 2030 1,2<br />
97 Irel<strong>and</strong> 1.2 0.6 0.5 4 4 4 5 1990 1.3<br />
98 tSaudi Arabia 4.7 4.3 3.8 13 20 42 85 2045 1.8<br />
99 tlsrael 2.8 1.7 1.4 4 5 7 7 2005 1.5<br />
100 New Zeal<strong>and</strong> 1.3 1.0 0.6 3 4 4 4 2030 1.3<br />
101 tSingapore 1.6 1.1 0.8 3 3 3 3 2030 1.3<br />
102 tHongKong 2.0 1.6 1.0 6 6 7 7 2030 1.3<br />
103 Italy 0.6 0.2 -0.1 57 57 53 42 2030 1.1<br />
104 United Kingdom 0.2 0.1 0.1 57 57 57 54 2030 1.1<br />
105 Australia 1.8 1.4 1.4 16 20 23 23 2030 1.4<br />
106 Belgium 0.3 0.0 0.0 10 10 10 8 2030 1.1<br />
107 Netherl<strong>and</strong>s 0.9 0.5 0.3 15 15 15 13 2030 1.1<br />
108 Austria 0.3 0.0 -0.1 8 7 7 6 2030 1.1<br />
109 France 0.7 0.5 0.4 56 59 61 58 2030 1.1<br />
110 Germany, Fed. Rep. 0.3 -0.1 -0.2 61 59 53 43 2030 1.0<br />
111 Finl<strong>and</strong> 0.3 0.5 0.2 5 5 5 4 2030 1.1<br />
112 tKuwait 7.1 4.5 3.1 2 3 4 6 2020 1.8<br />
113 Denmark 0.5 0.0 -0.1 5 5 5 4 2030 1.0<br />
114 Canada 1.3 1.0 0.8 26 29 31 29 2030 1.3<br />
115 Sweden 0.5 0.1 0.0 8 8 8 8 2030 1.0<br />
116 Japan 1.2 0.6 0.4 122 128 125 113 2030 1.1<br />
117 tUnited Arab Emirates 15.3 5.2 2.4 1 2 3 3 2020 1.3<br />
118 Norway 0.6 0.3 0.3 4 4 4 4 2030 1.1<br />
119 United States 1.0 1.0 0.8 244 269 300 295 2030 1.3<br />
120 Switzerl<strong>and</strong> 0.5 0.3 -0.1 7 6 6 5 2030 1.0<br />
Total reporting economies 2.1 w 1.8 w 1.7 w 4,640 t 5,783 t 7,906 t<br />
Oil exporters 2.7 w 2.7 w 2.4 w 578 t 790 t 1,228 t<br />
Nonreporting nonmembers 1.0 w 1.0 w .. 371 t 410 t 474 t<br />
a. For the assumptions used in the projections, see the technical notes.<br />
215


