

Financial systems and development
Financial systems and development
Financial systems and development

Create successful ePaper yourself
Turn your PDF publications into a flip-book with our unique Google optimized e-Paper software.
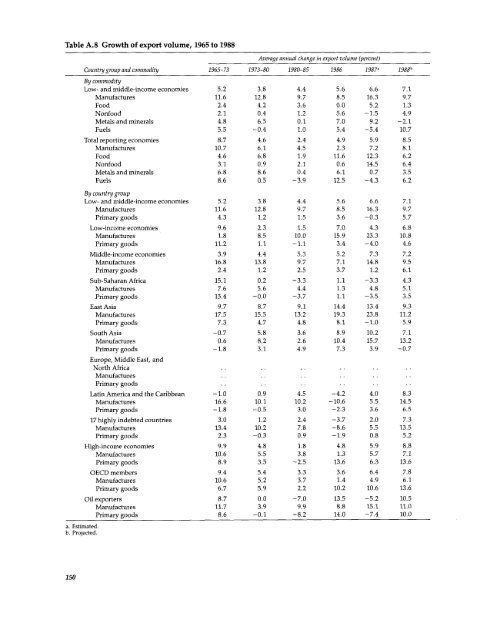
Table A.8 Growth of export volume, 1965 to 1988<br />
Average annual change in export volume (percent)<br />
Country group <strong>and</strong> commodity 1965-73 1973-80 1980-85 1986 1987a 1 98 8 b<br />
By commodity<br />
Low- <strong>and</strong> middle-income economies 5.2 3.8 4.4 5.6 6.6 7.1<br />
Manufactures 11.6 12.8 9.7 8.5 16.3 9.7<br />
Food 2.4 4.2 3.6 0.0 5.2 1.3<br />
Nonfood 2.1 0.4 1.2 5.6 -1.5 4.9<br />
Metals <strong>and</strong> minerals 4.8 6.5 0.1 7.0 9.2 -2.1<br />
Fuels 5.5 -0.4 1.0 5.4 -5.4 10.7<br />
Total reporting economies 8.7 4.6 2.4 4.9 5.9 8.5<br />
Manufactures 10.7 6.1 4.5 2.3 7.2 8.1<br />
Food 4.6 6.8 1.9 11.6 12.3 6.2<br />
Nonfood 3.1 0.9 2.1 0.6 14.5 6.4<br />
Metals <strong>and</strong> minerals 6.8 8.6 0.4 6.1 0.7 3.5<br />
Fuels 8.6 0.5 -3.9 12.5 -4.3 6.2<br />
By country group<br />
Low- <strong>and</strong> middle-income economies 5.2 3.8 4.4 5.6 6.6 7.1<br />
Manufactures 11.6 12.8 9.7 8.5 16.3 9.7<br />
Primary goods 4.3 1.2 1.5 3.6 -0.3 5.7<br />
Low-income economies 9.6 2.3 1.5 7.0 4.3 6.8<br />
Manufactures 1.8 8.5 10.0 15.9 23.3 10.8<br />
Primary goods 11.2 1.1 -1.1 3.4 -4.0 4.6<br />
Middle-income economies 3.9 4.4 5.3 5.2 7.3 7.2<br />
Manufactures 16.8 13.8 9.7 7.1 14.8 9.5<br />
Primary goods 2.4 1.2 2.5 3.7 1.2 6.1<br />
Sub-Saharan Africa 15.1 0.2 -3.3 1.1 -3.3 4.3<br />
Manufactures 7.6 5.6 4.4 1.3 4.8 5.1<br />
Primary goods 15.4 -0.0 -3.7 1.1 -3.5 3.5<br />
East Asia 9.7 8.7 9.1 14.4 13.4 9.3<br />
Manufactures 17.5 15.5 13.2 19.3 23.8 11.2<br />
Primary goods 7.3 4.7 4.8 8.1 -1.0 5.9<br />
South Asia -0.7 5.8 3.6 8.9 10.2 7.1<br />
Manufactures 0.6 8.2 2.6 10.4 15.7 13.2<br />
Primary goods -1.8 3.1 4.9 7.3 3.9 -0.7<br />
Europe, Middle East, <strong>and</strong><br />
North Africa .. .. .. . . .<br />
Manufactures . .. .. .. ..<br />
Primary goods .. .. . ..<br />
LatinAmerica<strong>and</strong>theCaribbean -1.0 0.9 4.5 -4.2 4.0 8.3<br />
Manufactures 16.6 10.1 10.2 -10.6 5.5 14.5<br />
Primary goods -1.8 -0.5 3.0 -2.3 3.6 6.5<br />
17 highly indebted countries 3.0 1.2 2.4 -3.7 2.0 7.3<br />
Manufactures 13.4 10.2 7.8 -8.6 5.5 13.5<br />
Primary goods 2.3 -0.3 0.9 -1.9 0.8 5.2<br />
High-income economies 9.9 4.8 1.8 4.8 5.9 8.8<br />
Manufactures 10.6 5.5 3.8 1.3 5.7 7.1<br />
Primary goods 8.9 3.5 -2.5 13.6 6.3 13.6<br />
OECD members 9.4 5.4 3.3 3.6 6.4 7.8<br />
Manufactures 10.6 5.2 3.7 1.4 4.9 6.1<br />
Primary goods 6.7 5.9 2.2 10.2 10.6 13.6<br />
a. Estimated.<br />
b. Projected.<br />
Oil exporters 8.7 0.0 -7.0 13.5 -5.2 10.5<br />
Manufactures 11.7 3.9 9.9 8.8 15.1 11.0<br />
Primary goods 8.6 -0.1 -8.2 14.0 -7.4 10.0<br />
150


