

Financial systems and development
Financial systems and development
Financial systems and development

Create successful ePaper yourself
Turn your PDF publications into a flip-book with our unique Google optimized e-Paper software.
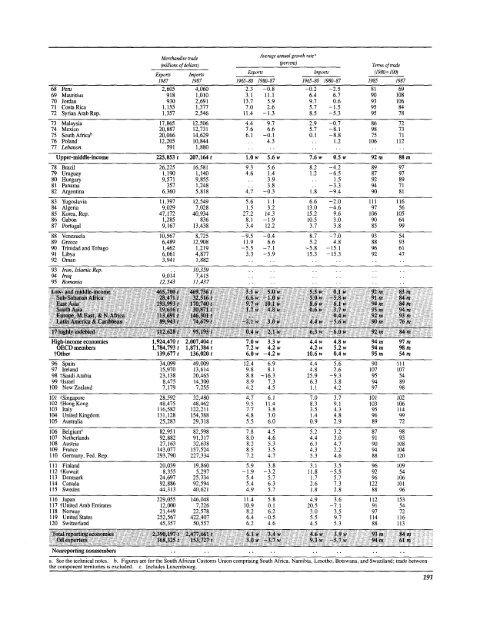
Merch<strong>and</strong>ise trade<br />
Average annual growth rate a<br />
(millions of dollarsl (percent) Terms of trade<br />
Eepores imports Exports Imports (1980=100)<br />
1987 1987 1965-80 1980-87 1965-80 1980-87 1985 1987<br />
68 Peru 2,605 4,060 2.3 -0.8 -0.2 -2.5 81 69<br />
69 Mauritius 918 1,010 3.1 11.1 6.4 6.7 90 108<br />
70 Jordan 930 2,691 13.7 5.9 9.7 0.6 93 106<br />
71 CostaRica 1,155 1,377 7.0 2.6 5.7 -1.5 95 84<br />
72 Syrian Arab Rep. 1,357 2,546 11.4 - 1.3 8.5 -5.3 95 78<br />
73 Malaysia 17,865 12,506 4.4 9.7 2.9 -0.7 86 72<br />
74 Mexico 20,887 12.731 7.6 6.6 5.7 -8.1 98 73<br />
75 South Africab 20,066 14,629 6.1 -0.1 0.1 -8.8 75 71<br />
76 Pol<strong>and</strong> 12,205 10,844 .. 4.3 .. 1.2 106 112<br />
77 Lebanon 591 1,880 .. .. .. . .<br />
Upper-middle-income 225,853 t 207,164 t 1.0 w 5.6 w 7.6 w 0.5 w 92 m 88 m<br />
78 Brazil 26,225 16,581 9.3 5.6 8.2 -4.2 89 97<br />
79 Uruguay 1,190 1,140 4.6 1.4 1.2 -6.5 87 97<br />
80 Hungary 9,571 9,855 .. 3.9 .. 1.5 92 89<br />
81 Panama 357 1,248 .. 3.8 .. -3.3 94 71<br />
82 Argentina 6,360 5,818 4.7 -0.3 1.8 -9.4 90 81<br />
83 Yugoslavia 11,397 12,549 5.6 1.1 6.6 -2.0 111 116<br />
84 Algeria 9,029 7,028 1.5 3.2 13.0 -4.6 97 56<br />
85 Korea, Rep. 47,172 40,934 27.2 14.3 15.2 9.6 106 105<br />
86 Gabon 1,285 836 8.1 -1.9 10.5 3.0 90 64<br />
87 Portugal 9,167 13.438 3.4 12.2 3.7 3.8 85 99<br />
88 Venezuela 10,567 8,725 -9.5 -0.4 8.7 -7.0 93 54<br />
89 Greece 6,489 12,908 11.9 6.6 5.2 4.8 88 93<br />
90 Trinidad <strong>and</strong> Tobago 1,462 1,219 -5.5 -7.1 -5.8 -15.1 96 61<br />
91 Libya 6,061 4,877 3.3 -5.9 15.3 -15.3 92 47<br />
92 Oman 3,941 1,882 .<br />
93 Iran, Islamic Rep. .. 10,359 .. .. .. ..<br />
94 Iraq 9,014 7,415 .. .. .. ..<br />
95 Romania 12,543 11,437 .. .. .. .. .<br />
Low- <strong>and</strong> middle-inceome 465,780 t 469,736 t 3.1 w 5.0 w 5.5 w 0.1 w 92 m 83 m<br />
Sub-SaharanAfrica 28,471t 32,516t 6.6w -1.0w 5.0w -5.8w 91m 84 m<br />
FastAsia 193,993t 170,740t 9.7w 10.1w 8.6 w 6.1w 94 m 84 m<br />
South Asia 19,616e t 30,S71 t 1.7 w 4.8 w 0.6 w 3.7 w 95 m 94 m<br />
Europe, M.East, & N.Africa 113,691 t 146,301 t. .. .. 0.4w 92 m 93 m<br />
Laths America & Caibbean 89,943 f '74,679 t -2.1 w 3.0w 4.4 w -5.6 w 90 m 76 m<br />
17 highly indebted 112,628 t 95,193 t 0.4 w 2.1 w 6.3 w -6.0 w 92 m 84 m<br />
High-income economies 1,924,470 t 2,007,404 t 7.0 w 3.3 w 4.4 w 4.8 w 94 m 97 m<br />
OECD members 1,784,793 t 1,871,384 t 7.2 w 4.2 w 4.2 w 5.2 w 94 m 98 m<br />
tOther 139,677 t 136,020 t 6.0 w -4.2 w 10.6 w 0.4 w 95 m 54 m<br />
96 Spain 34.099 49,009 12.4 6.9 4.4 5.6 90 111<br />
97 Irel<strong>and</strong> 15,970 13,614 9.8 8.1 4.8 2.6 107 107<br />
98 tSaudi Arabia 23,138 20,465 8.8 -16.3 25.9 -9.3 95 54<br />
99 Ilsrael 8,475 14,300 8.9 7.3 6.3 3.8 94 89<br />
100 New Zeal<strong>and</strong> 7,179 7,255 4.2 4.5 1.1 4.2 97 98<br />
101 tSingapore 28,592 32,480 4.7 6.1 7.0 3.7 101 102<br />
102 tHong Kong 48.475 48,462 9.5 11.4 8.3 9.1 103 106<br />
103 Italy 116,582 122,211 7.7 3.8 3.5 4.3 95 114<br />
104 United Kingdom 131,128 154,388 4.8 3.0 1.4 4.8 96 99<br />
105 Australia 25,283 29,318 5.5 6.0 0.9 2.9 89 72<br />
106 Belgiumc 82,951 82,598 7.8 4.5 5.2 3.2 87 98<br />
107 Netherl<strong>and</strong>s 92,882 91,317 8.0 4.6 4.4 3.0 91 93<br />
108 Austria 27.163 32,638 8.2 5.3 6.1 4.7 90 108<br />
109 France 143,077 157.524 8.5 3.5 4.3 2.2 94 104<br />
110 Germany,Fed. Rep. 293,790 227,334 7.2 4.7 5.3 4.6 88 120<br />
111 Finl<strong>and</strong> 20,039 19,860 5.9 3.8 3.1 3.5 96 109<br />
112 tKuwait 8,355 5,297 -1.9 -3.2 11.8 -5.5 92 54<br />
113 Denmark 24.697 25,334 5.4 5.7 1.7 5.7 96 106<br />
114 Canada 92,886 92,594 5.4 6.3 2.6 7.3 122 101<br />
115 Sweden 44,313 40,621 4.9 5.7 1.8 2.8 88 96<br />
116 Japan 229,055 146,048 11.4 5.8 4.9 3.6 112 153<br />
117 tUnited Arab Emirates 12.000 7,226 10.9 0.1 20.5 -7.1 91 54<br />
118 Norway 21,449 22,578 8.2 6.2 3.0 3.5 97 72<br />
119 UnitedStates 252,567 422,407 6.4 -0.5 5.5 9.7 114 116<br />
120 Switzerl<strong>and</strong> 45,357 50,557 6.2 4.6 4.5 5.3 88 113<br />
Total reporting economies 2,390,197t 2,477,661 t 6.1 w 3.4w 4.6w 3.9w 93 m 84 m<br />
Oil exporters 168,325 t 153,727 t 3.0 w -3.7 w 9.3 w -5.7 w 94 m 61 m<br />
Nonreporting nonmembers .. .. .. .. ..<br />
a. See the technical notes. b. Figures are for the South African Customs Union comprising South Africa, Namibia, Lesotho, Botswana, <strong>and</strong> Swazil<strong>and</strong>; trade between<br />
the component territories is excluded. c. Includes Luxembourg.<br />
191


