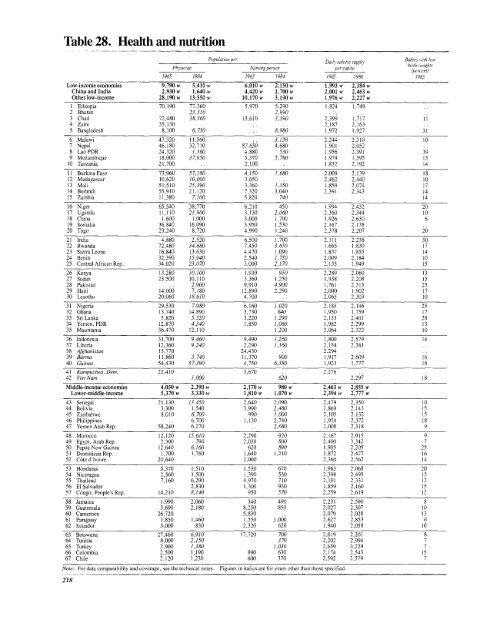
Table 28. Health <strong>and</strong> nutrition population per: Dails calorie suppix Babies with lowt Phvsictan Nursing person -~~~-birth ,eights Phsca Nusngprsnper capita (percent) 1965 1984 1965 1984 1965 1986 1985 Lw-inlcome economies 9,790 w 5,410 w 6,010 w 2,150 w 1,993 w 2,384 w China <strong>and</strong> India 2,930 w 1,640 w 4,420 w 1,700 w 2,001 w 2,463 ws Other low-income 28,190 w 13,550 w 10,170 w 3,130 w 1,976 w 2,227 w I Ethiopia 70,190 77,360 5,970 5.290 1,824 1.749 2 Bhutan . . 23,310 .. 2,990. 3 Chad 72,480 38,360 13.610 3,390 2,399 1,717 1 I 4 Zaire 35,130 ... .2,187 2.163 5 Banigladesh 8,100 6,730 .. 8,980 1,972 .927 31 6 Malawi 47,320 11,560 .. 3,130 2,244 2,310 10 7 Nepal 46. 180 32,710 87,650 4,680 1,901 2,052 8 Lao PDR 24,320 1,360 4,880 530 1.956 2,391 39 9 Mozambique 18,000 37,950 5,370 5,760 1.979 1,595 15 10 Tanzania 21,700 . 2,100 . 1,832 2.192 14 11Burkina Faso 73,960 57,180 4.150 1,680 2,009 2.139 18 12 Madagascar 10,620 10,000 3,650 . 2,462 2.440 10 13 Mali 51,510 25,390 3.360 1,350 1,859 2,074 17 14 Burundi 55,910 21.120 7.320 3,040 2.391 2,343 14 IS Zambia 11,380 7,100 5,820 740 .. .14 16 Niger 65,540 38,770 6,210 450 1,994 2,432 20 17 Ug<strong>and</strong>a 11,110 21,900 3,130 2,060 2,360 2,344 10 18 China 1,600 1.000 3,000 1.~700 1,926 2,630 6 19 Somnalia 36,840 16,090 3,950 1,530 2,167 2.138 20 Togo 23,240 8,720 4,990 1,240 2,378 2.207 20 21 India 4,880 2,520 6.500 1,700 2,111 2,238 30 22 Rw<strong>and</strong>a 72,480 34,680 7.450 3,650 1,665 1,830 17 23 Sierra Leone 16,840 13,630 4,470 1.090 1.837 1,855 14 24 Benin 32,390 15.940 2,540 1, 750 2.009 2,184 10 25 Central African Rep. 34,020 23,070 3,000 2,170 2.135 1,949 IS5 26 Kenya 13,280 10,100 1,930 950 2,289 2.060 13 27 Sudan 23,500 10,110 3,360 1,250 1,938 2.208 IS5 28 Pakistan .. 2,900 9,910 4,900 1,761 2.315 25 29 Haiti 14,000 7,180 12,890 2,290 2,000 1.902 17 30 Lesotho 20.060 18,610 4,700 . 2.065 2,303 10 31Nigeria 29,530 7.980 6,160 1,020 2.185 2,146 25 32 Ghana 13,740 14.890 3,730 640 1.950 1.759 17 33 Sri Lanka 5,820 5,520 3,220 1,290 2.153 2.401 28 34 Yemnen. PDR 12,870 4,340 1.850 1,060 1,982 2.299 13 35 Mauritania 36,470 12.110 .. 1.200 2,064 2.322 10 36 Indonesia 31,700 9,460 9.490 1,260 1.800 2,579 14 37 Liberia 12,360 9,240 2.290 1,360 2.154 2.381 38 Afghanistan 15,770 . 24,430 . 2.294 39 Burma 11.860 3,740 11.370 900 1.917 2,609 16 40 Guinea 54,430 57.390 4,750 6,380 1.923 1,777 18 41 Kamnpuchea, Dem. 22,410 . 3.670 . 2,276 42 VietNiam ,. 1,000 . 620 . 2,297 18 Middle-incomeconomies 4,030 w 2,390 w 2,170 w 980 w 2,463 w 2,855 ws Lower-middle-income 5,370 w 3,330 w 1,810 w 1,070 w 2,394 ws 2,777 w 43 Senegal 21,130 13,450 2.640 2,090 2.479 2,350 10 44 Bolivia 3.300 1.540 3.990 2,480 1.869 2,143 15 45 Zimnbabwe 8,010 6,700 990 1,000 2.105 2, 132 15 46 Philippines .. 6.700 1.130 2.740 1,924 2,372 18 47 Yemen Arab Rep. 58,240 6.270 .. 2.680 2.008 2,318 9 48 Morocco 12,120 15,610 2,290 920 2.167 2.915 9 49 Egypt, Arab Rep. 2.300 790 2,030 800 2,400 3.342 7 50 Papua New Guinea 12.640 6,160 620 890 1,905 2,205 25 51Dominican Rep. 1.700 1,760 1,640 1.210 1,872 2.477 16 52 C6te d'lvoire 20,640 . 2.000 . 2,360 2,562 14 53 Hondur-as 5,370 1,510 1.530 670 1,963 2.068 20 54 Nicaragua 2,560 1,500 1.390 530 2.398 2,495 15 55 Thail<strong>and</strong> 7.160 6,290 4,970 710 2,101 2,331 12 56 El Salvador .. 2,830 1,300 930 1,859 2,160 15 57 Conigo, People's Rep. 14,210 8,140 950 570 2,259 2.619 12t 58 Jamaica 1,990 2.060 340 490 2.231 2,590 8 59 Guatemala 3,690 2.180 8,250 850 2,027 2,307 10 60 Cameroon 26,720 . 5.830 . 2,079 2,028 13 61 Paraguay 1,850 1,460 1.550 1,000 2,627 2,853 6 62 Ecuador 3.000 830 2.320 620 1.940 2,058 10 63 Botswatna 27,460 6,910 17,720 700 2,019 2,201 8 64 Tunisia 8,000 2,150 . 370 2,202 2,994 7 65 Turkey 2,900 1,380 .. 1,030 2,659 3.229 7 66 Colombia 2,500 1,190 890 630 2.174 2,543 15 67 Chile 2,120 1.230 600 370 2,592 2.579 7 Note: For data comparability <strong>and</strong> coverage, see the technical notes. Figures in italics are for years other than those specified. 218
Population per: Daily calorie suppl Bbirth wheig ts Physician Nursmngperson per capita (percent) 1965 1984 1965 1984 1965 1986 1985 68 Peru ,650 1040 910 2,325 2,246 9 69 Mauritius 3,930 1,900 2,030 580 2,272 2,748 9 70 Jordan 4,710 1,140 1.810 1,300 2,314 2,991 7 71 Costa Rica 2,010 960 630 450 2,366 2,803 9 72 SyrianArabRep. 5,400 1,260 1,440 2,195 3,260 9 73 Malaysia 6.200 1,930 1,320 1,010 2,247 2,730 9 74 Mexico 2.080 1,240 980 880 2,644 3,132 15 75 South Afnca 2,050 490 2,623 2,924 12 76 Pol<strong>and</strong> 800 490 410 190 3,229 3,336 8 77 Lebanon 1,010 2,030 2,489 Upper-middle-income 2,430 w 1,170 w 2,590 w 870 w 2,556 w 2,970 w 78 Brazil 2.500 1,080 3,100 1,210 2,402 2,656 8 79 Uruguay 880 510 590 2,812 2,648 8 80 Hungary 630 310 240 170 3,171 3.569 10 81 Panama 2,130 980 1,600 390 2,255 2,446 8 82 Argentina 600 370 610 980 3,210 3,210 6 83 Yugoslavia 1,200 550 850 260 3,289 3,563 7 84 Algeria 8,590 2,330 11,770 330 1,681 2,715 9 85 Korea, Rep. 2,680 1,170 2.970 590 2.256 2,907 9 86 Gabon . 2.790 760 270 1,881 2,521 16 87 Portugal 1.240 410 1.160 .. 2,517 3,151 8 88 Venezuela 1,210 700 560 . 2,321 2.494 9 89 Greece 710 350 600 450 3,049 3.688 6 90 Trinidad <strong>and</strong> Tobago 3.810 960 560 260 2,497 3.082 91 Libya 3,860 690 850 350 1.925 3,601 5 92 Oman 23,790 1,700 6,420 770 .. .. 14 93 Iran, Islamic Rep. 3,800 2,690 4.170 1,050 2.204 3,313 9 94 Iraq 5,000 1.740 2,910 1,660 2,150 2,932 9 95 Romaiiia 760 570 400 280 2,978 3,373 6 Low- <strong>and</strong> middleincome 8,300w 4,630 w 5,030 w 1,860w 2,116 w 2,509 w Sub-Saharan Africa 33.840 w 23,760 w 5,460 w 2,130 w 2,096 w 2,101 w EastAsia 5,600w 2,400w 4,060w 1,560w 1,937w 2,594w South Asia 6,220 w 3,570 w 8,380 w 2,710 w 2,060 w 2,228 w Europe, M.East, & N.Africa 4,820 w 2,440 w 3,410 w 1,160 w 2,610 w 3,177 w Latin America & Caribbean 2,370 w 1,230w 2,090w 1,010w 2,457w 2,701 w 17 highly indebted 7,930 w 3,440 w 2,460 w 1,160 w 2,422 w 2,635 w High-incomeconomies OECD members 940 w 870 w 470 w 450 w 470 w 420 w 130 w 130 w 3,083 w 3,100 w 3,375 w 3,390 w tOther 4,430 w 800 w 2,590 w 260w 2,324 w 3,001 w 96 Spain 800 320 1,220 260 2,822 3,359 97 Irel<strong>and</strong> 950 680 170 140 3,546 3.632 4 98 tSaudi Arabia 9,400 690 6,060 320 1,853 3,004 6 99 tlsrael 400 350 300 110 2,784 3,061 7 100 New Zeal<strong>and</strong> 820 580 570 80 3,237 3,463 5 101 tSingapore 1,900 1,310 600 2,297 2,840 7 102 tHong Kong 2,520 1,070 1,250 240 2,504 2,859 4 103 Italy 1,850 230 790 .. 3,091 3,523 7 104 United Kingdom 870 . . 200 120 3.353 3,256 7 105 Australia 720 440 150 110 3,118 3,326 6 106 Belgium 700 330 590 110 ,. ,, 5 107 Netherl<strong>and</strong>s 860 450 270 170 3,108 3,326 4 108 Austria 720 390 350 180 3,231 3,428 6 109 France 830 320 380 110 3,217 3.336 5 110 Germany, Fed. Rep. 640 380 500 230 3,102 3,528 5 111 Finl<strong>and</strong> 1,300 440 180 60 3,111 3,122 4 112 tKuwait 790 640 270 200 2,945 3,021 7 113 Denmark 740 400 190 60 3,395 3,633 6 114 Canada 770 510 190 120 3,212 3,462 6 115 Sweden 910 390 310 1OO 2,888 3,064 4 116 Japan 970 660 410 180 2,687 2,864 5 117 tUnited Arab Emirates 1,010 . . 390 2,705 3.733 118 Norway 790 450 340 60 3,032 3,223 4 119 United States 670 470 310 70 3,224 3,645 7 120 Switzeri<strong>and</strong> 710 700 270 130 3,412 3,437 5 Total reporting economies 6,650 w 3,930 w 4,010 w 1,570 w 2,322 w 2,655 w Oilexporters 17,940w 5,120w 5,740w 1,010w 2,128w 2,738w Nonreporting nonmembers 770 w 2,210 w 370 w 290 w 3,130 w 3,358 w 219
- Page 1:
~~~~/ , -. \-E:-: - :: 0 0 - PUB768
- Page 4 and 5:
Oxford University Press NEW YORK OX
- Page 6 and 7:
countries' financial institutions i
- Page 8 and 9:
4 Financial sector issues in develo
- Page 10 and 11:
7.1 Shares of medium- and long-term
- Page 12 and 13:
* Fractional reserve banking. The p
- Page 14 and 15:
NTB Nontariff barrier * Growth rate
- Page 16 and 17:
and grew even faster in 1988 than i
- Page 18 and 19:
etter loan recovery procedures, mor
- Page 20 and 21:
l~ ~~~ ~ ~~~~~~~~~~~~~~~~~~~ ;:: ;
- Page 22 and 23:
The early years of the recovery wer
- Page 24 and 25:
Figure 1.4 Growth of export volume
- Page 26 and 27:
Figure 1.6 Saving and investment ra
- Page 28 and 29:
edly, in Argentina, Brazil, and Mex
- Page 30 and 31:
5~~~~ '~ ' S " ''t.*:'.: .:,0!3gft"
- Page 32 and 33:
Box 1.2 Debt concepts A variety of
- Page 34 and 35:
Table 1.1 Selected economic indicat
- Page 36 and 37:
Figure 1.8 Domestic and external li
- Page 38 and 39:
Box 1.3 Foreign equity investment E
- Page 40 and 41:
j Box 2.1 Life without money "Some
- Page 42 and 43:
other ways too. By imposing direct
- Page 44 and 45:
Box 2.2 Transaction costs and the s
- Page 46 and 47:
Box 2.3 Real interest rates and gro
- Page 48 and 49:
I Box 2.4 Swapping risk All economi
- Page 50 and 51:
Box 2.5 Deposit insurance Most high
- Page 52 and 53:
GOVERNMENT. As well as being regula
- Page 54 and 55:
and receivables, whereas developmen
- Page 56 and 57:
with the expansion of nonlocal trad
- Page 58 and 59:
over. Even so, bankers and industri
- Page 60 and 61:
Box 3.3 Financial swindles i Swindl
- Page 62 and 63:
Box 3.4 Financial underdevelopment
- Page 64 and 65:
Box 3.6 Universal banking One of th
- Page 66 and 67:
1960s. They speeded the internation
- Page 68 and 69:
4 Financial sector issues in develo
- Page 70 and 71:
Box 4.1 Directed credit in Turkey ,
- Page 72 and 73:
Box 4.2 Lending program for small e
- Page 74 and 75:
Box 4.4 The Botswana Development Co
- Page 76 and 77:
markets to finance their deficits,
- Page 78 and 79:
0~~~~~ = == X .. _- -- = -_ _ _ __
- Page 80 and 81:
Figure 4.3 Financial savings and th
- Page 82 and 83:
Box 4.8 Financial indexation in Bra
- Page 84 and 85:
Financial systems in distress Not s
- Page 86 and 87:
t !< 4> - !: e z u- >as uei- i.e_.S
- Page 88 and 89:
tem. They have succeeded in stemmin
- Page 90 and 91:
governments gave too little thought
- Page 92 and 93:
Box 5.4 The U.S. savings and loan c
- Page 94 and 95:
or take a step in the other directi
- Page 96 and 97:
have been even larger. The cost of
- Page 98 and 99:
~Foundations offinancial systems If
- Page 100 and 101:
(an issue closely related to the as
- Page 102 and 103:
several centuries. The spread of su
- Page 104 and 105:
Bankruptcy and reorganization monit
- Page 106 and 107:
Box 6.5 Elements of a bank supervis
- Page 108 and 109:
they attempted to discipline bank m
- Page 110 and 111:
Developing financial systems What s
- Page 112 and 113:
Figure 7.1 Shares of medium- and lo
- Page 114 and 115:
Box 7.3 The financial history of a
- Page 116 and 117:
Box 7.4 Housing finance The formal
- Page 118 and 119:
Box 7.5 Bank modernization: Indones
- Page 120 and 121:
DEVELOPMENT FINANCE INSTITUTIONS. T
- Page 122 and 123:
esources in government securities o
- Page 124 and 125:
strides in recent years in establis
- Page 126 and 127:
Issues in informal finance Small-sc
- Page 128 and 129:
Box 8.2 Rotating savings and credit
- Page 130 and 131:
original amount to the renter by th
- Page 132 and 133:
cooperatives' managers because it a
- Page 134 and 135:
Box 8.4 The Badan Kredit Kecamatan:
- Page 136 and 137:
Toward more liberal and open financ
- Page 138 and 139:
a brief period firms faced rapid ch
- Page 140 and 141:
Box 9.2 Financial reform in Korea K
- Page 142 and 143:
In the next stage, financial reform
- Page 144 and 145:
industry, policy reforms and the re
- Page 146 and 147:
Conclusions of the Report challenge
- Page 148 and 149:
tion "Risks and costs of finance" d
- Page 150 and 151:
Montes-Negret, Fernando. "The Decli
- Page 152 and 153:
D.C.: International Monetary Fund a
- Page 154 and 155:
Harberger, Arnold C. 1985. "Lessons
- Page 156 and 157:
croenterprises: Programs or Markets
- Page 158 and 159:
Douglas Graham, and J. D. Von Pisch
- Page 160 and 161:
Table A.2 Population and GNP per ca
- Page 162 and 163:
Table A.5 GDP structure of producti
- Page 164 and 165:
Table A.8 Growth of export volume,
- Page 166 and 167:
Table A.10 Growth of long-term debt
- Page 168 and 169:
Table A.12 Composition of debt outs
- Page 170 and 171:
Contents Key 157 Introduction and m
- Page 172 and 173:
Introduction The World Development
- Page 174 and 175:
Throughout the World Development In
- Page 176 and 177:
Population _ 0-15 million The color
- Page 178 and 179:
Table 1. Basic indicators __ GNP pe
- Page 180 and 181:
Table 2. Growth of production______
- Page 182 and 183: Table 3. Structure of production __
- Page 184 and 185: Table 4. Agriculture and food Value
- Page 186 and 187: Table 5. Commercial energy ~~Energy
- Page 188 and 189: Table 6. Structure of manufacturing
- Page 190 and 191: Table 7. Manufacturing earnings and
- Page 192 and 193: Table 8. Growth of consumption and
- Page 194 and 195: Table 9. Structure of demand Distri
- Page 196 and 197: Table 10. Structure of consumption_
- Page 198 and 199: Table 11. Central government expend
- Page 200 and 201: Table 12. Central government curren
- Page 202 and 203: Table 13. Money and interest rates
- Page 204 and 205: Table 14. Growth of merchandise tra
- Page 206 and 207: Table 15. Structure of merchandise
- Page 208 and 209: Table 16. Structure of merchandise
- Page 210 and 211: Table 17. OECD imports of manufactu
- Page 212 and 213: Table 18. Balance of payments and r
- Page 214 and 215: Table 19. Official development assi
- Page 216 and 217: Table 20. Official development assi
- Page 218 and 219: Table 21. Total external debt Long-
- Page 220 and 221: Table 22. Flow of public and privat
- Page 222 and 223: Table 23. Total external public and
- Page 224 and 225: Table 24. External public debt and
- Page 226 and 227: Table 25. Terms of external public
- Page 228 and 229: Table 26. Population growth and pro
- Page 230 and 231: Table 27. Demography and fertility
- Page 234 and 235: Table 29. Education Percentage ofag
- Page 236 and 237: Table 30. Income distribution and I
- Page 238 and 239: Table 31. Urbanization Urban popula
- Page 240 and 241: Table 32. Women in development_____
- Page 242 and 243: Technical notes This twelfth editio
- Page 244 and 245: Box A.1. Basic indicators for count
- Page 246 and 247: Box A.2. Selected indicators for no
- Page 248 and 249: from the Food and Agriculture Organ
- Page 250 and 251: Exports of goods and nonfactor serv
- Page 252 and 253: spectively. Since 1987 data are not
- Page 254 and 255: The table reports the value of manu
- Page 256 and 257: teed, and private nonguaranteed lon
- Page 258 and 259: the Demographic and Health Surveys,
- Page 260 and 261: also the one used within the global
- Page 262 and 263: Bibliography Production and domesti
- Page 264 and 265: Country classifications: World Deve
- Page 266: I i