

Financial systems and development
Financial systems and development
Financial systems and development

Create successful ePaper yourself
Turn your PDF publications into a flip-book with our unique Google optimized e-Paper software.
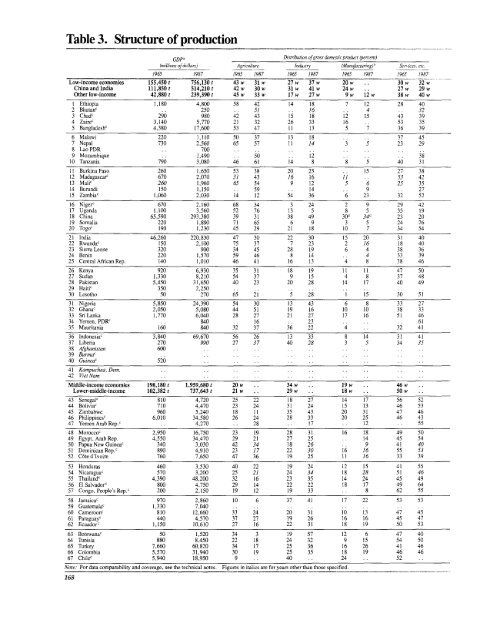
Table 3. Structure of production<br />
_______<br />
GDP'<br />
Distribution of gross domestic product (percent)<br />
(millions of dollars) Agriculture Industry Waon ufiactnrng)'<br />
Services, etc.<br />
1965 1987 1965 1987 1965 1987 1965 1987 1965 1987<br />
Low-incomeconomies<br />
China <strong>and</strong> India<br />
155,450 t<br />
111,850 t<br />
756,130 t<br />
514,210 t<br />
43 w<br />
42 w<br />
31 w<br />
30 w<br />
27w<br />
31 w<br />
7<br />
41 w<br />
w 2<br />
24 w<br />
3-0 w<br />
27 w<br />
32 w<br />
29 w<br />
Other low-income 42,880 t 239,390 t 45 w 33 w 17 w 27 w 9 w 12 w 38 w 40 w<br />
I Ethiopia 1,180 4,800 58 42 14 18 7 12 28 40<br />
2 Bhutan' 250 51 16 4 32<br />
3 Chad'~ 290 980 42 43 15 18 12 15 43 39<br />
4 Zaire' 3,140 5,770 21 32 26 33 16 53 35<br />
5 Bangladesh' 4,380 17,600 53 47 11 13 5 7 36 39<br />
6 Malawi 220 1,110 50 37 13 18 37 45<br />
7 Nepal 730 2,560 65 57 11 14 3 5 23 29<br />
8 Lao PDR 700 . ..<br />
9 Mozambique 1,490 50 12 38<br />
10Tanzania 790 3,080 46 61 14 8 8 5 40 31<br />
11Burkina Faso 260 1,650 53 38 20 25 15 27 38<br />
12 Madagascar' 670 2,070 31 43 16 16 11 53 42<br />
13 Mali' 269 1,960 65 54 9 12 5 6 25 35<br />
14 Burundi 150 1,150 59 14 9 27<br />
15 Zambia' 1,060 2,030 14 12 54 36 6 23 32 52<br />
16 Niger' 670 2,160 68 34 3 24 2 9 29 42<br />
17 Ug<strong>and</strong>a 1,100 3,560 52 76 13 5 8 5 35 19<br />
18 China 65,590 293,380 39 31 38 49 300 34' 23 20<br />
19Somalia 220 1,890 71 65 6 9 3 5 24 26<br />
20 Togo' 190 1,230 45 29 21 18 10 7 34 54<br />
21 India 46,260 220,830 47 30 22 30 15 20 31 40<br />
22 Rw<strong>and</strong>a, 150 2,100 75 37 7 23 2 16 18 40<br />
23 Sierra Leone 320 900 34 45 28 19 6 4 38 36<br />
24 Benin 220 1,570 59 46 8 14 4 33 39<br />
25 Central Affican Rep. 140 1,010 46 41 16 13 4 8 38 46<br />
26 Kenya 920 6,930 35 31 18 19 11 11t 47 50<br />
27 Sudan 1,330 8.210 54 37 9 15 4 8 37 48<br />
28 Pakistan 5,450 31,650 40 23 20 28 14 17 40 49<br />
29 Haiti' 350 2,250<br />
30 Lesotho 50 270 65 21 5 28 1 15 30 51<br />
31Nigeria 5,850 24,390 54 30 13 43 6 8 33 27<br />
32 Ghana' 2,050 5,080 44 51 19 16 10 10 38 33<br />
33 Sri Lanka 1,770 6,040 28 27 21 27 17 16 51 46<br />
34 Yemen, PDR' 840 . . 16 . . 23 .. . . 61<br />
35 Mauritania 160 840 32 37 36 22 4 .. 32 41<br />
36 Indonesia' 3,840 69,670 56 26 13 33 8 14 31 41<br />
37 Liberia 270 990 27 37 40 28 3 5 34 35<br />
38 Afghanistan 600.. .. ..<br />
39 Burma'.... ... ..<br />
40 Guinea' 520 ..<br />
41 Kampuchea, Dem.. ... ..<br />
42 Viet Nam .<br />
Middle-incomeconomies 198,180 t 1,959,680 t 20 w 34 w 19 w 46 w<br />
Lower-middle-income 102,382 t 737,643 t 21 w 29 w 18 w 50 w<br />
43 Senegal' 810 4,720 25 22 18 27 14 17 56 52<br />
44 Bolivia, 710 4,470 23 24 31 24 15 13 46 53<br />
45 Zimbabwe 960 5,240 18 11 35 43 20 31 47 46<br />
46 Philippines' 6,010 34,580 26 24 28 33 20 25 46 43<br />
47 Yemen Arab Rep.' .4,270 .. 28 . 17 . 12 .. 55<br />
48 Morocco' 2,950 16,750 23 19 28 31 16 18 49 50<br />
49 Egypt, Arab Rep. 4,550 34,470 29 21 27 25 .. 14 45 54<br />
50 Papua New Guinea' 340 3,030 42 34 18 26 .. 9 41 40<br />
51 Dominican Rep.' 890 4,910 23 17 22 30 16 16 55 53<br />
52 C6te d'lvoire 760 7,650 47 36 19 25 11 16 33 39<br />
53 Honduras 460 3,530 40 22 19 24 12 15 41 55<br />
54 Nicaragua' 570 3,200 25 2] 24 34 18 28 51 46<br />
55 Thail<strong>and</strong>' 4,390 48,200 32 16 23 35 14 24 45 49<br />
56 El Salvador' 800 4,750 29 14 22 22 18 17 49 64<br />
57 Congo, People's Rep.c 200 2,150 19 12 19 33 .. 8 62 55<br />
58 Jamaica' 970 2,860 10 6 37 41 17 22 53 53<br />
59 Guatemala' 1,330 7,040 .<br />
60 Cameroon, 810 12,660 33 24 20 31 10 13 47 45<br />
61 Paraguay' 440 4,570 37 27 19 26 16 16 45 47<br />
62 Ecuador' 1,150 10,610 27 16 22 31 18 19 50 53<br />
63 Botswana' 50 1,520 34 3 19 57 12 6 47 40<br />
64 Tunisia 880 8,450 22 18 24 32 9 15 54 50<br />
65 Turkey 7,660 60,820 34 17 25 36 16 26 41 46<br />
66 Colombia 5,570 31,940 30 19 25 35 18 19 46 46<br />
67 Chile' 5,940 18.950 9 .. 40 .24 .. 52<br />
Note. For data comparability <strong>and</strong> coverage, see the technical notes .<br />
168<br />
Figures in italics are for yeacs other than thoue specified.


