- Page 2 and 3:
PHYSIOLOGY AND MOLECULAR BIOLOGY OF
- Page 4 and 5:
A C.I.P. Catalogue record for this
- Page 6 and 7:
About the Editors K.V. Madhava Rao
- Page 8 and 9:
LIST OF CONTRIBUTORS K. AKASHI Grad
- Page 10 and 11:
List of Contributors xiii NAVINDER
- Page 12 and 13:
PREFACE Increasing agricultural pro
- Page 14 and 15:
2 K.V. Madhava Rao Abiotic stresses
- Page 16 and 17: 4 K.V. Madhava Rao SOME O THE PROMI
- Page 18 and 19: 6 K.V. Madhava Rao 2. WATER STRESS
- Page 20 and 21: 8 K.V. Madhava Rao 5. FREEZING STRE
- Page 22 and 23: 10 K.V. Madhava Rao of these pathwa
- Page 24 and 25: 12 K.V. Madhava Rao Bray, E.A. (199
- Page 26 and 27: 14 K.V. Madhava Rao Rao, K.V. Madha
- Page 28 and 29: 16 A. Yokota, K. Takahara and K. Ak
- Page 30 and 31: 18 A. Yokota, K. Takahara and K. Ak
- Page 32 and 33: 20 A. Yokota, K. Takahara and K. Ak
- Page 34 and 35: 22 A. Yokota, K. Takahara and K. Ak
- Page 36 and 37: 24 A. Yokota, K. Takahara and K. Ak
- Page 38 and 39: 26 A. Yokota, K. Takahara and K. Ak
- Page 40 and 41: 28 A. Yokota, K. Takahara and K. Ak
- Page 42 and 43: 30 A. Yokota, K. Takahara and K. Ak
- Page 44 and 45: 32 A. Yokota, K. Takahara and K. Ak
- Page 46 and 47: 34 A. Yokota, K. Takahara and K. Ak
- Page 48 and 49: 36 A. Yokota, K. Takahara and K. Ak
- Page 50 and 51: 38 A. Yokota, K. Takahara and K. Ak
- Page 52 and 53: 41 CHAPTER 3 SALT STRESS ZORA DAJIC
- Page 54 and 55: Salt Stress 43 activities (mainly i
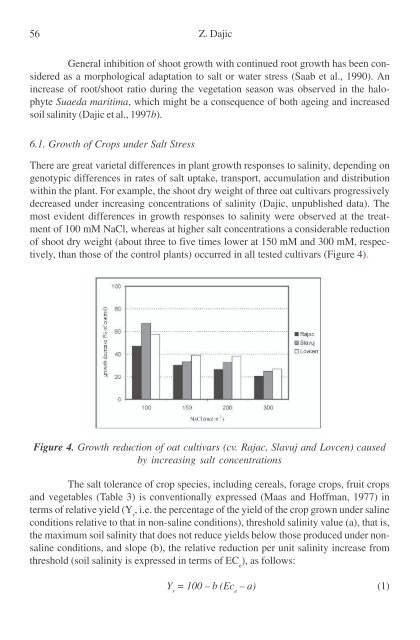
- Page 56 and 57: Salt Stress 45 In summary, mechanis
- Page 58 and 59: Salt Stress 47 tolerance research i
- Page 60 and 61: Salt Stress 49 need to rely on sodi
- Page 62 and 63: Salt Stress 51 (Echeverria, 2000).
- Page 64 and 65: Salt Stress 53 Therefore, the capac
- Page 68 and 69: Salt Stress 57 Table 3. Salt tolera
- Page 70 and 71: Salt Stress 59 6.2. Nitrogen Fixati
- Page 72 and 73: Salt Stress 61 A significant number
- Page 74 and 75: Salt Stress 63 macromolecules, irre
- Page 76 and 77: Salt Stress 65 8.2. Ion Homeostasis
- Page 78 and 79: Salt Stress 67 1997), is speculated
- Page 80 and 81: Salt Stress 69 together with the At
- Page 82 and 83: Salt Stress 71 important role in si
- Page 84 and 85: Salt Stress 73 Figure 5. Determinan
- Page 86 and 87: Salt Stress 75 9.1.Transgenic Plant
- Page 88 and 89: Salt Stress 77 tolerance from halop
- Page 90 and 91: Salt Stress 79 sponse and yield (Su
- Page 92 and 93: Salt Stress 81 Table 5. Possible ut
- Page 94 and 95: Salt Stress 83 monitored with fluor
- Page 96 and 97: Salt Stress 85 Func. Plant Biol. 29
- Page 98 and 99: Salt Stress 87 Dajic, Z., Stevanovi
- Page 100 and 101: Salt Stress 89 Gouia, H., Ghorbal,
- Page 102 and 103: Salt Stress 91 Larcher, W. (1995).
- Page 104 and 105: Salt Stress 93 Munns, R. and James,
- Page 106 and 107: Salt Stress 95 Rausell, A., Kanhono
- Page 108 and 109: Salt Stress 97 durum wheat crops gr
- Page 110 and 111: Salt Stress 99 Yoshida, K. (2002).
- Page 112 and 113: 102 T.D. Sharkey and S.M. Schrader
- Page 114 and 115: 104 T.D. Sharkey and S.M. Schrader
- Page 116 and 117:
106 T.D. Sharkey and S.M. Schrader
- Page 118 and 119:
108 T.D. Sharkey and S.M. Schrader
- Page 120 and 121:
110 T.D. Sharkey and S.M. Schrader
- Page 122 and 123:
112 T.D. Sharkey and S.M. Schrader
- Page 124 and 125:
114 T.D. Sharkey and S.M. Schrader
- Page 126 and 127:
116 T.D. Sharkey and S.M. Schrader
- Page 128 and 129:
118 T.D. Sharkey and S.M. Schrader
- Page 130 and 131:
120 T.D. Sharkey and S.M. Schrader
- Page 132 and 133:
122 T.D. Sharkey and S.M. Schrader
- Page 134 and 135:
124 T.D. Sharkey and S.M. Schrader
- Page 136 and 137:
126 T.D. Sharkey and S.M. Schrader
- Page 138 and 139:
128 T.D. Sharkey and S.M. Schrader
- Page 140 and 141:
131 CHAPTER 5 FREEZING STRESS: SYST
- Page 142 and 143:
Freezing Stress 133 Whereas, in the
- Page 144 and 145:
Freezing Stress 135 genes at the tr
- Page 146 and 147:
Freezing Stress 137 with physiologi
- Page 148 and 149:
Freezing Stress 139 (1997). However
- Page 150 and 151:
Freezing Stress 141 (Barnett et al.
- Page 152 and 153:
Freezing Stress 143 (dehydrin) prot
- Page 154 and 155:
Freezing Stress 145 in cytosolic Ca
- Page 156 and 157:
Freezing Stress 147 Phospholiphase
- Page 158 and 159:
Freezing Stress 149 Accumulation of
- Page 160 and 161:
Freezing Stress 151 Ideker, T., Gal
- Page 162 and 163:
Freezing Stress 153 ellin acid on f
- Page 164 and 165:
Freezing Stress 155 Yoshida, S. and
- Page 166 and 167:
158 A.R. Reddy and A.S. Raghavendra
- Page 168 and 169:
160 A.R. Reddy and A.S. Raghavendra
- Page 170 and 171:
162 A.R. Reddy and A.S. Raghavendra
- Page 172 and 173:
164 A.R. Reddy and A.S. Raghavendra
- Page 174 and 175:
166 A.R. Reddy and A.S. Raghavendra
- Page 176 and 177:
168 A.R. Reddy and A.S. Raghavendra
- Page 178 and 179:
170 A.R. Reddy and A.S. Raghavendra
- Page 180 and 181:
172 A.R. Reddy and A.S. Raghavendra
- Page 182 and 183:
174 A.R. Reddy and A.S. Raghavendra
- Page 184 and 185:
176 A.R. Reddy and A.S. Raghavendra
- Page 186 and 187:
178 A.R. Reddy and A.S. Raghavendra
- Page 188 and 189:
180 A.R. Reddy and A.S. Raghavendra
- Page 190 and 191:
182 A.R. Reddy and A.S. Raghavendra
- Page 192 and 193:
184 A.R. Reddy and A.S. Raghavendra
- Page 194 and 195:
186 A.R. Reddy and A.S. Raghavendra
- Page 196 and 197:
188 K. Janardhan Reddy constitution
- Page 198 and 199:
190 K. Janardhan Reddy World nitrog
- Page 200 and 201:
192 K. Janardhan Reddy nitrogen def
- Page 202 and 203:
194 K. Janardhan Reddy endoplasmic
- Page 204 and 205:
196 K. Janardhan Reddy drought cond
- Page 206 and 207:
198 K. Janardhan Reddy Manganese-de
- Page 208 and 209:
200 K. Janardhan Reddy zinc deficie
- Page 210 and 211:
202 K. Janardhan Reddy Table 12 . E
- Page 212 and 213:
204 K. Janardhan Reddy Table 14. Ef
- Page 214 and 215:
206 K. Janardhan Reddy Table 15. Th
- Page 216 and 217:
208 K. Janardhan Reddy Table 17. Co
- Page 218 and 219:
210 K. Janardhan Reddy 18. MOLECULA
- Page 220 and 221:
212 K. Janardhan Reddy Bush, D.S.,
- Page 222 and 223:
214 K. Janardhan Reddy and Cobbett,
- Page 224 and 225:
216 K. Janardhan Reddy 143, 109-111
- Page 226 and 227:
219 CHAPTER 8 HEAVY METAL STRESS KS
- Page 228 and 229:
Heavy Metal Stress 221 porter) and
- Page 230 and 231:
Heavy Metal Stress 223 Figure 1. Su
- Page 232 and 233:
Heavy Metal Stress 225 is enzymatic
- Page 234 and 235:
Heavy Metal Stress 227 BjPCS1 was e
- Page 236 and 237:
Heavy Metal Stress 229 following: (
- Page 238 and 239:
Heavy Metal Stress 231 a precursor
- Page 240 and 241:
Heavy Metal Stress 233 notype. Incr
- Page 242 and 243:
Table 1. Proposed specificity and l
- Page 244 and 245:
Heavy Metal Stress 237 4.2. Chapero
- Page 246 and 247:
Heavy Metal Stress 239 of prokaryot
- Page 248 and 249:
Heavy Metal Stress 241 5. HYPERACCU
- Page 250 and 251:
Table 2. Genes introduced into plan
- Page 252 and 253:
Heavy Metal Stress 245 7. CONCLUSIO
- Page 254 and 255:
Heavy Metal Stress 247 controlled b
- Page 256 and 257:
Heavy Metal Stress 249 Kägi, J.H.R
- Page 258 and 259:
Heavy Metal Stress 251 Murphy, A.,
- Page 260 and 261:
Heavy Metal Stress 253 through xyle
- Page 262 and 263:
255 CHAPTER 9 METABOLIC ENGINEERING
- Page 264 and 265:
Metabolic Engineering for Stress To
- Page 266 and 267:
Metabolic Engineering for Stress To
- Page 268 and 269:
Metabolic Engineering for Stress To
- Page 270 and 271:
Metabolic Engineering for Stress To
- Page 272 and 273:
Metabolic Engineering for Stress To
- Page 274 and 275:
Metabolic Engineering for Stress To
- Page 276 and 277:
Metabolic Engineering for Stress To
- Page 278 and 279:
Metabolic Engineering for Stress To
- Page 280 and 281:
Metabolic Engineering for Stress To
- Page 282 and 283:
Metabolic Engineering for Stress To
- Page 284 and 285:
Metabolic Engineering for Stress To
- Page 286 and 287:
Metabolic Engineering for Stress To
- Page 288 and 289:
Metabolic Engineering for Stress To
- Page 290 and 291:
Metabolic Engineering for Stress To
- Page 292 and 293:
Metabolic Engineering for Stress To
- Page 294 and 295:
Metabolic Engineering for Stress To
- Page 296 and 297:
Metabolic Engineering for Stress To
- Page 298 and 299:
Metabolic Engineering for Stress To
- Page 300 and 301:
Metabolic Engineering for Stress To
- Page 302 and 303:
Metabolic Engineering for Stress To
- Page 304 and 305:
Metabolic Engineering for Stress To
- Page 306 and 307:
Metabolic Engineering for Stress To
- Page 308 and 309:
302 A.K. Tyagi, S. Vij and N. Saini
- Page 310 and 311:
304 A.K. Tyagi, S. Vij and N. Saini
- Page 312 and 313:
306 A.K. Tyagi, S. Vij and N. Saini
- Page 314 and 315:
308 A.K. Tyagi, S. Vij and N. Saini
- Page 316 and 317:
310 A.K. Tyagi, S. Vij and N. Saini
- Page 318 and 319:
312 A.K. Tyagi, S. Vij and N. Saini
- Page 320 and 321:
314 A.K. Tyagi, S. Vij and N. Saini
- Page 322 and 323:
316 A.K. Tyagi, S. Vij and N. Saini
- Page 324 and 325:
318 A.K. Tyagi, S. Vij and N. Saini
- Page 326 and 327:
Table 3. Continued... Source Resour
- Page 328 and 329:
322 A.K. Tyagi, S. Vij and N. Saini
- Page 330 and 331:
324 A.K. Tyagi, S. Vij and N. Saini
- Page 332 and 333:
326 A.K. Tyagi, S. Vij and N. Saini
- Page 334 and 335:
328 A.K. Tyagi, S. Vij and N. Saini
- Page 336 and 337:
330 A.K. Tyagi, S. Vij and N. Saini
- Page 338 and 339:
332 A.K. Tyagi, S. Vij and N. Saini
- Page 340 and 341:
334 A.K. Tyagi, S. Vij and N. Saini
- Page 342 and 343:
336 Index Auxins, 146 Avena sativa
- Page 344 and 345:
338 Expressed sequence tags (ESTs),
- Page 346 and 347:
340 Index Magnesium, 195 Mairiena s
- Page 348 and 349:
342 Index Processes less sensitive
- Page 350 and 351:
344 Index Sunflecks, 104 Sunflower,