

2007 National Roadside Survey of Alcohol and Drug Use by Drivers
2007 National Roadside Survey of Alcohol and Drug Use by Drivers
2007 National Roadside Survey of Alcohol and Drug Use by Drivers

Create successful ePaper yourself
Turn your PDF publications into a flip-book with our unique Google optimized e-Paper software.
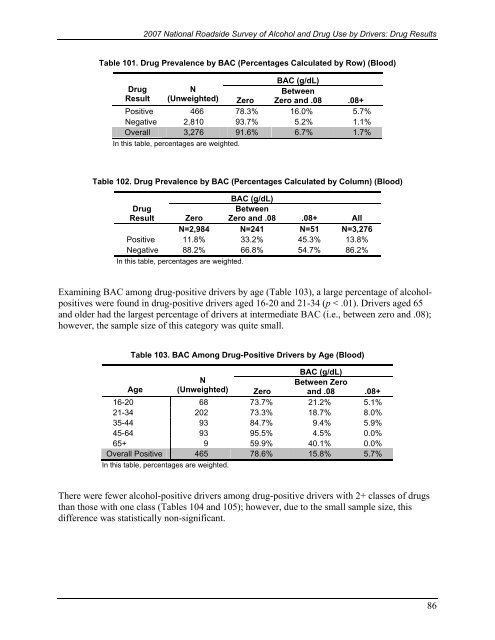
<strong>2007</strong> <strong>National</strong> <strong>Roadside</strong> <strong>Survey</strong> <strong>of</strong> <strong>Alcohol</strong> <strong>and</strong> <strong>Drug</strong> <strong>Use</strong> <strong>by</strong> <strong>Drivers</strong>: <strong>Drug</strong> ResultsTable 101. <strong>Drug</strong> Prevalence <strong>by</strong> BAC (Percentages Calculated <strong>by</strong> Row) (Blood)BAC (g/dL)<strong>Drug</strong>NBetweenResult (Unweighted) Zero Zero <strong>and</strong> .08 .08+Positive 466 78.3% 16.0% 5.7%Negative 2,810 93.7% 5.2% 1.1%Overall 3,276 91.6% 6.7% 1.7%In this table, percentages are weighted.Table 102. <strong>Drug</strong> Prevalence <strong>by</strong> BAC (Percentages Calculated <strong>by</strong> Column) (Blood)BAC (g/dL)<strong>Drug</strong>Result ZeroBetweenZero <strong>and</strong> .08 .08+ AllN=2,984 N=241 N=51 N=3,276Positive 11.8% 33.2% 45.3% 13.8%Negative 88.2% 66.8% 54.7% 86.2%In this table, percentages are weighted.Examining BAC among drug-positive drivers <strong>by</strong> age (Table 103), a large percentage <strong>of</strong> alcoholpositiveswere found in drug-positive drivers aged 16-20 <strong>and</strong> 21-34 (p < .01). <strong>Drivers</strong> aged 65<strong>and</strong> older had the largest percentage <strong>of</strong> drivers at intermediate BAC (i.e., between zero <strong>and</strong> .08);however, the sample size <strong>of</strong> this category was quite small.Table 103. BAC Among <strong>Drug</strong>-Positive <strong>Drivers</strong> <strong>by</strong> Age (Blood)BAC (g/dL)AgeNBetween Zero(Unweighted) Zero <strong>and</strong> .08 .08+16-20 68 73.7% 21.2% 5.1%21-34 202 73.3% 18.7% 8.0%35-44 93 84.7% 9.4% 5.9%45-64 93 95.5% 4.5% 0.0%65+ 9 59.9% 40.1% 0.0%Overall Positive 465 78.6% 15.8% 5.7%In this table, percentages are weighted.There were fewer alcohol-positive drivers among drug-positive drivers with 2+ classes <strong>of</strong> drugsthan those with one class (Tables 104 <strong>and</strong> 105); however, due to the small sample size, thisdifference was statistically non-significant.86

