

2007 National Roadside Survey of Alcohol and Drug Use by Drivers
2007 National Roadside Survey of Alcohol and Drug Use by Drivers
2007 National Roadside Survey of Alcohol and Drug Use by Drivers

Create successful ePaper yourself
Turn your PDF publications into a flip-book with our unique Google optimized e-Paper software.
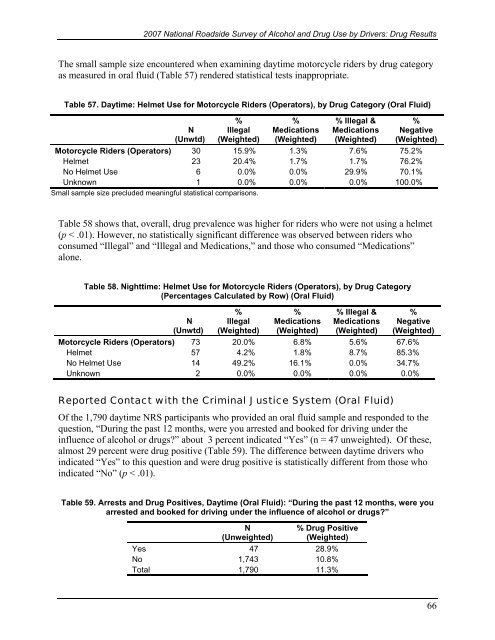
<strong>2007</strong> <strong>National</strong> <strong>Roadside</strong> <strong>Survey</strong> <strong>of</strong> <strong>Alcohol</strong> <strong>and</strong> <strong>Drug</strong> <strong>Use</strong> <strong>by</strong> <strong>Drivers</strong>: <strong>Drug</strong> ResultsThe small sample size encountered when examining daytime motorcycle riders <strong>by</strong> drug categoryas measured in oral fluid (Table 57) rendered statistical tests inappropriate.Table 57. Daytime: Helmet <strong>Use</strong> for Motorcycle Riders (Operators), <strong>by</strong> <strong>Drug</strong> Category (Oral Fluid)N(Unwtd)%Illegal(Weighted)%Medications(Weighted)% Illegal &Medications(Weighted)%Negative(Weighted)Motorcycle Riders (Operators) 30 15.9% 1.3% 7.6% 75.2%Helmet 23 20.4% 1.7% 1.7% 76.2%No Helmet <strong>Use</strong> 6 0.0% 0.0% 29.9% 70.1%Unknown 1 0.0% 0.0% 0.0% 100.0%Small sample size precluded meaningful statistical comparisons.Table 58 shows that, overall, drug prevalence was higher for riders who were not using a helmet(p < .01). However, no statistically significant difference was observed between riders whoconsumed “Illegal” <strong>and</strong> “Illegal <strong>and</strong> Medications,” <strong>and</strong> those who consumed “Medications”alone.Table 58. Nighttime: Helmet <strong>Use</strong> for Motorcycle Riders (Operators), <strong>by</strong> <strong>Drug</strong> Category(Percentages Calculated <strong>by</strong> Row) (Oral Fluid)N(Unwtd)%Illegal(Weighted)%Medications(Weighted)% Illegal &Medications(Weighted)%Negative(Weighted)Motorcycle Riders (Operators) 73 20.0% 6.8% 5.6% 67.6%Helmet 57 4.2% 1.8% 8.7% 85.3%No Helmet <strong>Use</strong> 14 49.2% 16.1% 0.0% 34.7%Unknown 2 0.0% 0.0% 0.0% 0.0%Reported Contact with the Criminal Justice System (Oral Fluid)Of the 1,790 daytime NRS participants who provided an oral fluid sample <strong>and</strong> responded to thequestion, “During the past 12 months, were you arrested <strong>and</strong> booked for driving under theinfluence <strong>of</strong> alcohol or drugs?” about 3 percent indicated “Yes” (n = 47 unweighted). Of these,almost 29 percent were drug positive (Table 59). The difference between daytime drivers whoindicated “Yes” to this question <strong>and</strong> were drug positive is statistically different from those whoindicated “No” (p < .01).Table 59. Arrests <strong>and</strong> <strong>Drug</strong> Positives, Daytime (Oral Fluid): “During the past 12 months, were youarrested <strong>and</strong> booked for driving under the influence <strong>of</strong> alcohol or drugs?”N(Unweighted)% <strong>Drug</strong> Positive(Weighted)Yes 47 28.9%No 1,743 10.8%Total 1,790 11.3%66

