2007 National Roadside Survey of Alcohol and Drug Use by Drivers
2007 National Roadside Survey of Alcohol and Drug Use by Drivers
2007 National Roadside Survey of Alcohol and Drug Use by Drivers
Create successful ePaper yourself
Turn your PDF publications into a flip-book with our unique Google optimized e-Paper software.
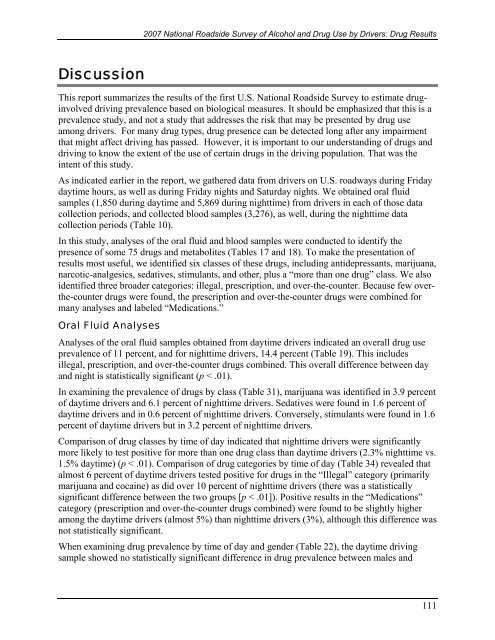
<strong>2007</strong> <strong>National</strong> <strong>Roadside</strong> <strong>Survey</strong> <strong>of</strong> <strong>Alcohol</strong> <strong>and</strong> <strong>Drug</strong> <strong>Use</strong> <strong>by</strong> <strong>Drivers</strong>: <strong>Drug</strong> ResultsDiscussionThis report summarizes the results <strong>of</strong> the first U.S. <strong>National</strong> <strong>Roadside</strong> <strong>Survey</strong> to estimate druginvolveddriving prevalence based on biological measures. It should be emphasized that this is aprevalence study, <strong>and</strong> not a study that addresses the risk that may be presented <strong>by</strong> drug useamong drivers. For many drug types, drug presence can be detected long after any impairmentthat might affect driving has passed. However, it is important to our underst<strong>and</strong>ing <strong>of</strong> drugs <strong>and</strong>driving to know the extent <strong>of</strong> the use <strong>of</strong> certain drugs in the driving population. That was theintent <strong>of</strong> this study.As indicated earlier in the report, we gathered data from drivers on U.S. roadways during Fridaydaytime hours, as well as during Friday nights <strong>and</strong> Saturday nights. We obtained oral fluidsamples (1,850 during daytime <strong>and</strong> 5,869 during nighttime) from drivers in each <strong>of</strong> those datacollection periods, <strong>and</strong> collected blood samples (3,276), as well, during the nighttime datacollection periods (Table 10).In this study, analyses <strong>of</strong> the oral fluid <strong>and</strong> blood samples were conducted to identify thepresence <strong>of</strong> some 75 drugs <strong>and</strong> metabolites (Tables 17 <strong>and</strong> 18). To make the presentation <strong>of</strong>results most useful, we identified six classes <strong>of</strong> these drugs, including antidepressants, marijuana,narcotic-analgesics, sedatives, stimulants, <strong>and</strong> other, plus a “more than one drug” class. We alsoidentified three broader categories: illegal, prescription, <strong>and</strong> over-the-counter. Because few overthe-counterdrugs were found, the prescription <strong>and</strong> over-the-counter drugs were combined formany analyses <strong>and</strong> labeled “Medications.”Oral Fluid AnalysesAnalyses <strong>of</strong> the oral fluid samples obtained from daytime drivers indicated an overall drug useprevalence <strong>of</strong> 11 percent, <strong>and</strong> for nighttime drivers, 14.4 percent (Table 19). This includesillegal, prescription, <strong>and</strong> over-the-counter drugs combined. This overall difference between day<strong>and</strong> night is statistically significant (p < .01).In examining the prevalence <strong>of</strong> drugs <strong>by</strong> class (Table 31), marijuana was identified in 3.9 percent<strong>of</strong> daytime drivers <strong>and</strong> 6.1 percent <strong>of</strong> nighttime drivers. Sedatives were found in 1.6 percent <strong>of</strong>daytime drivers <strong>and</strong> in 0.6 percent <strong>of</strong> nighttime drivers. Conversely, stimulants were found in 1.6percent <strong>of</strong> daytime drivers but in 3.2 percent <strong>of</strong> nighttime drivers.Comparison <strong>of</strong> drug classes <strong>by</strong> time <strong>of</strong> day indicated that nighttime drivers were significantlymore likely to test positive for more than one drug class than daytime drivers (2.3% nighttime vs.1.5% daytime) (p < .01). Comparison <strong>of</strong> drug categories <strong>by</strong> time <strong>of</strong> day (Table 34) revealed thatalmost 6 percent <strong>of</strong> daytime drivers tested positive for drugs in the “Illegal” category (primarilymarijuana <strong>and</strong> cocaine) as did over 10 percent <strong>of</strong> nighttime drivers (there was a statisticallysignificant difference between the two groups [p < .01]). Positive results in the “Medications”category (prescription <strong>and</strong> over-the-counter drugs combined) were found to be slightly higheramong the daytime drivers (almost 5%) than nighttime drivers (3%), although this difference wasnot statistically significant.When examining drug prevalence <strong>by</strong> time <strong>of</strong> day <strong>and</strong> gender (Table 22), the daytime drivingsample showed no statistically significant difference in drug prevalence between males <strong>and</strong>111


