

2007 National Roadside Survey of Alcohol and Drug Use by Drivers
2007 National Roadside Survey of Alcohol and Drug Use by Drivers
2007 National Roadside Survey of Alcohol and Drug Use by Drivers

Create successful ePaper yourself
Turn your PDF publications into a flip-book with our unique Google optimized e-Paper software.
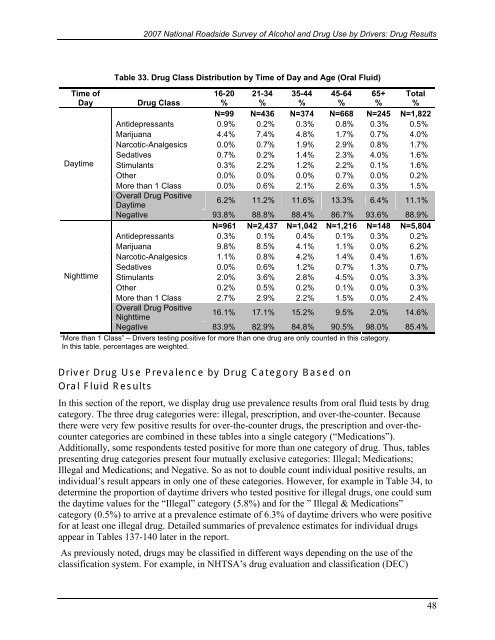
<strong>2007</strong> <strong>National</strong> <strong>Roadside</strong> <strong>Survey</strong> <strong>of</strong> <strong>Alcohol</strong> <strong>and</strong> <strong>Drug</strong> <strong>Use</strong> <strong>by</strong> <strong>Drivers</strong>: <strong>Drug</strong> ResultsTime <strong>of</strong>DayDaytimeNighttimeTable 33. <strong>Drug</strong> Class Distribution <strong>by</strong> Time <strong>of</strong> Day <strong>and</strong> Age (Oral Fluid)<strong>Drug</strong> Class16-20%21-34%35-44%45-64%65+%Total%N=99 N=436 N=374 N=668 N=245 N=1,822Antidepressants 0.9% 0.2% 0.3% 0.8% 0.3% 0.5%Marijuana 4.4% 7.4% 4.8% 1.7% 0.7% 4.0%Narcotic-Analgesics 0.0% 0.7% 1.9% 2.9% 0.8% 1.7%Sedatives 0.7% 0.2% 1.4% 2.3% 4.0% 1.6%Stimulants 0.3% 2.2% 1.2% 2.2% 0.1% 1.6%Other 0.0% 0.0% 0.0% 0.7% 0.0% 0.2%More than 1 Class 0.0% 0.6% 2.1% 2.6% 0.3% 1.5%Overall <strong>Drug</strong> PositiveDaytime6.2% 11.2% 11.6% 13.3% 6.4% 11.1%Negative 93.8% 88.8% 88.4% 86.7% 93.6% 88.9%N=961 N=2,437 N=1,042 N=1,216 N=148 N=5,804Antidepressants 0.3% 0.1% 0.4% 0.1% 0.3% 0.2%Marijuana 9.8% 8.5% 4.1% 1.1% 0.0% 6.2%Narcotic-Analgesics 1.1% 0.8% 4.2% 1.4% 0.4% 1.6%Sedatives 0.0% 0.6% 1.2% 0.7% 1.3% 0.7%Stimulants 2.0% 3.6% 2.8% 4.5% 0.0% 3.3%Other 0.2% 0.5% 0.2% 0.1% 0.0% 0.3%More than 1 Class 2.7% 2.9% 2.2% 1.5% 0.0% 2.4%Overall <strong>Drug</strong> PositiveNighttime16.1% 17.1% 15.2% 9.5% 2.0% 14.6%Negative 83.9% 82.9% 84.8% 90.5% 98.0% 85.4%“More than 1 Class” – <strong>Drivers</strong> testing positive for more than one drug are only counted in this category.In this table, percentages are weighted.Driver <strong>Drug</strong> <strong>Use</strong> Prevalence <strong>by</strong> <strong>Drug</strong> Category Based onOral Fluid ResultsIn this section <strong>of</strong> the report, we display drug use prevalence results from oral fluid tests <strong>by</strong> drugcategory. The three drug categories were: illegal, prescription, <strong>and</strong> over-the-counter. Becausethere were very few positive results for over-the-counter drugs, the prescription <strong>and</strong> over-thecountercategories are combined in these tables into a single category (“Medications”).Additionally, some respondents tested positive for more than one category <strong>of</strong> drug. Thus, tablespresenting drug categories present four mutually exclusive categories: Illegal; Medications;Illegal <strong>and</strong> Medications; <strong>and</strong> Negative. So as not to double count individual positive results, anindividual’s result appears in only one <strong>of</strong> these categories. However, for example in Table 34, todetermine the proportion <strong>of</strong> daytime drivers who tested positive for illegal drugs, one could sumthe daytime values for the “Illegal” category (5.8%) <strong>and</strong> for the ” Illegal & Medications”category (0.5%) to arrive at a prevalence estimate <strong>of</strong> 6.3% <strong>of</strong> daytime drivers who were positivefor at least one illegal drug. Detailed summaries <strong>of</strong> prevalence estimates for individual drugsappear in Tables 137-140 later in the report.As previously noted, drugs may be classified in different ways depending on the use <strong>of</strong> theclassification system. For example, in NHTSA’s drug evaluation <strong>and</strong> classification (DEC)48

