

2007 National Roadside Survey of Alcohol and Drug Use by Drivers
2007 National Roadside Survey of Alcohol and Drug Use by Drivers
2007 National Roadside Survey of Alcohol and Drug Use by Drivers

Create successful ePaper yourself
Turn your PDF publications into a flip-book with our unique Google optimized e-Paper software.
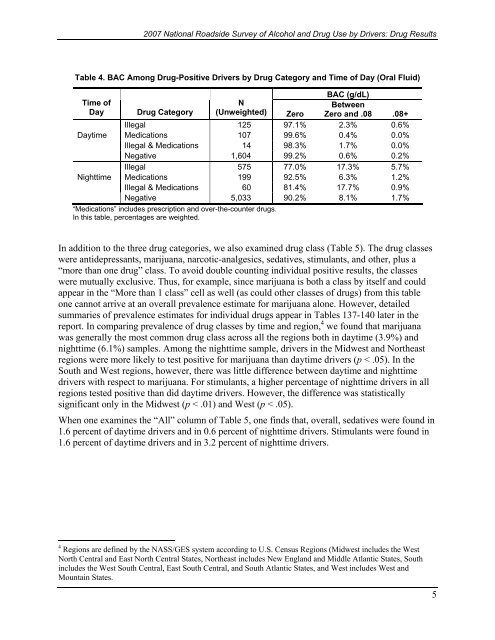
<strong>2007</strong> <strong>National</strong> <strong>Roadside</strong> <strong>Survey</strong> <strong>of</strong> <strong>Alcohol</strong> <strong>and</strong> <strong>Drug</strong> <strong>Use</strong> <strong>by</strong> <strong>Drivers</strong>: <strong>Drug</strong> ResultsTable 4. BAC Among <strong>Drug</strong>-Positive <strong>Drivers</strong> <strong>by</strong> <strong>Drug</strong> Category <strong>and</strong> Time <strong>of</strong> Day (Oral Fluid)BAC (g/dL)Time <strong>of</strong>NBetweenDay <strong>Drug</strong> Category (Unweighted) Zero Zero <strong>and</strong> .08 .08+Illegal 125 97.1% 2.3% 0.6%Daytime Medications 107 99.6% 0.4% 0.0%Illegal & Medications 14 98.3% 1.7% 0.0%Negative 1,604 99.2% 0.6% 0.2%Illegal 575 77.0% 17.3% 5.7%Nighttime Medications 199 92.5% 6.3% 1.2%Illegal & Medications 60 81.4% 17.7% 0.9%Negative 5,033 90.2% 8.1% 1.7%“Medications” includes prescription <strong>and</strong> over-the-counter drugs.In this table, percentages are weighted.In addition to the three drug categories, we also examined drug class (Table 5). The drug classeswere antidepressants, marijuana, narcotic-analgesics, sedatives, stimulants, <strong>and</strong> other, plus a“more than one drug” class. To avoid double counting individual positive results, the classeswere mutually exclusive. Thus, for example, since marijuana is both a class <strong>by</strong> itself <strong>and</strong> couldappear in the “More than 1 class” cell as well (as could other classes <strong>of</strong> drugs) from this tableone cannot arrive at an overall prevalence estimate for marijuana alone. However, detailedsummaries <strong>of</strong> prevalence estimates for individual drugs appear in Tables 137-140 later in thereport. In comparing prevalence <strong>of</strong> drug classes <strong>by</strong> time <strong>and</strong> region, 4 we found that marijuanawas generally the most common drug class across all the regions both in daytime (3.9%) <strong>and</strong>nighttime (6.1%) samples. Among the nighttime sample, drivers in the Midwest <strong>and</strong> Northeastregions were more likely to test positive for marijuana than daytime drivers (p < .05). In theSouth <strong>and</strong> West regions, however, there was little difference between daytime <strong>and</strong> nighttimedrivers with respect to marijuana. For stimulants, a higher percentage <strong>of</strong> nighttime drivers in allregions tested positive than did daytime drivers. However, the difference was statisticallysignificant only in the Midwest (p < .01) <strong>and</strong> West (p < .05).When one examines the “All” column <strong>of</strong> Table 5, one finds that, overall, sedatives were found in1.6 percent <strong>of</strong> daytime drivers <strong>and</strong> in 0.6 percent <strong>of</strong> nighttime drivers. Stimulants were found in1.6 percent <strong>of</strong> daytime drivers <strong>and</strong> in 3.2 percent <strong>of</strong> nighttime drivers.4 Regions are defined <strong>by</strong> the NASS/GES system according to U.S. Census Regions (Midwest includes the WestNorth Central <strong>and</strong> East North Central States, Northeast includes New Engl<strong>and</strong> <strong>and</strong> Middle Atlantic States, Southincludes the West South Central, East South Central, <strong>and</strong> South Atlantic States, <strong>and</strong> West includes West <strong>and</strong>Mountain States.5

