

2007 National Roadside Survey of Alcohol and Drug Use by Drivers
2007 National Roadside Survey of Alcohol and Drug Use by Drivers
2007 National Roadside Survey of Alcohol and Drug Use by Drivers

Create successful ePaper yourself
Turn your PDF publications into a flip-book with our unique Google optimized e-Paper software.
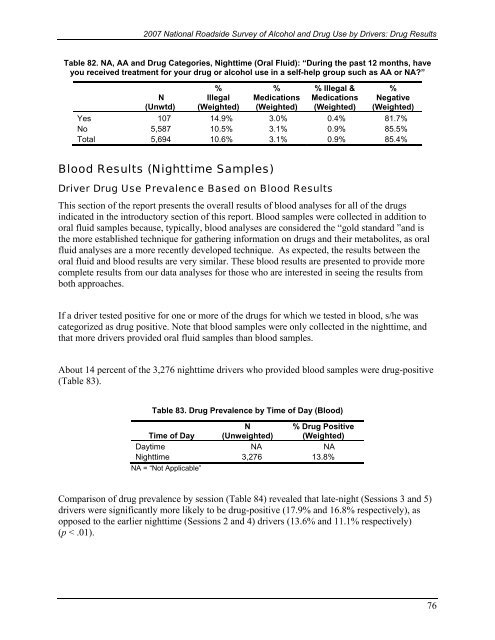
<strong>2007</strong> <strong>National</strong> <strong>Roadside</strong> <strong>Survey</strong> <strong>of</strong> <strong>Alcohol</strong> <strong>and</strong> <strong>Drug</strong> <strong>Use</strong> <strong>by</strong> <strong>Drivers</strong>: <strong>Drug</strong> ResultsTable 82. NA, AA <strong>and</strong> <strong>Drug</strong> Categories, Nighttime (Oral Fluid): “During the past 12 months, haveyou received treatment for your drug or alcohol use in a self-help group such as AA or NA?”N(Unwtd)%Illegal(Weighted)%Medications(Weighted)% Illegal &Medications(Weighted)%Negative(Weighted)Yes 107 14.9% 3.0% 0.4% 81.7%No 5,587 10.5% 3.1% 0.9% 85.5%Total 5,694 10.6% 3.1% 0.9% 85.4%Blood Results (Nighttime Samples)Driver <strong>Drug</strong> <strong>Use</strong> Prevalence Based on Blood ResultsThis section <strong>of</strong> the report presents the overall results <strong>of</strong> blood analyses for all <strong>of</strong> the drugsindicated in the introductory section <strong>of</strong> this report. Blood samples were collected in addition tooral fluid samples because, typically, blood analyses are considered the “gold st<strong>and</strong>ard ”<strong>and</strong> isthe more established technique for gathering information on drugs <strong>and</strong> their metabolites, as oralfluid analyses are a more recently developed technique. As expected, the results between theoral fluid <strong>and</strong> blood results are very similar. These blood results are presented to provide morecomplete results from our data analyses for those who are interested in seeing the results fromboth approaches.If a driver tested positive for one or more <strong>of</strong> the drugs for which we tested in blood, s/he wascategorized as drug positive. Note that blood samples were only collected in the nighttime, <strong>and</strong>that more drivers provided oral fluid samples than blood samples.About 14 percent <strong>of</strong> the 3,276 nighttime drivers who provided blood samples were drug-positive(Table 83).Table 83. <strong>Drug</strong> Prevalence <strong>by</strong> Time <strong>of</strong> Day (Blood)Time <strong>of</strong> DayN(Unweighted)% <strong>Drug</strong> Positive(Weighted)Daytime NA NANighttime 3,276 13.8%NA = “Not Applicable”Comparison <strong>of</strong> drug prevalence <strong>by</strong> session (Table 84) revealed that late-night (Sessions 3 <strong>and</strong> 5)drivers were significantly more likely to be drug-positive (17.9% <strong>and</strong> 16.8% respectively), asopposed to the earlier nighttime (Sessions 2 <strong>and</strong> 4) drivers (13.6% <strong>and</strong> 11.1% respectively)(p < .01).76

