

2007 National Roadside Survey of Alcohol and Drug Use by Drivers
2007 National Roadside Survey of Alcohol and Drug Use by Drivers
2007 National Roadside Survey of Alcohol and Drug Use by Drivers

You also want an ePaper? Increase the reach of your titles
YUMPU automatically turns print PDFs into web optimized ePapers that Google loves.
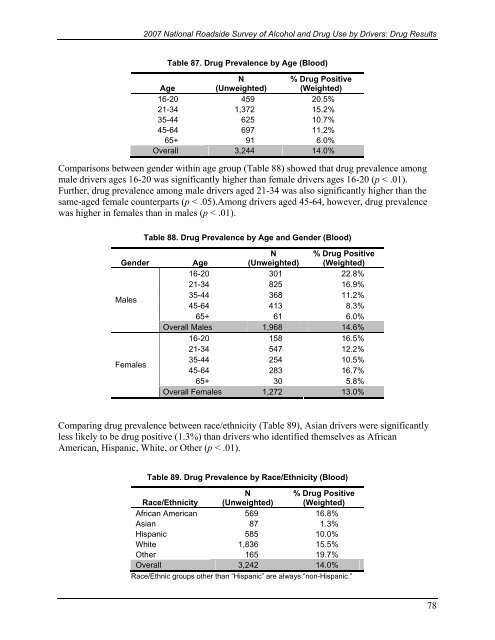
<strong>2007</strong> <strong>National</strong> <strong>Roadside</strong> <strong>Survey</strong> <strong>of</strong> <strong>Alcohol</strong> <strong>and</strong> <strong>Drug</strong> <strong>Use</strong> <strong>by</strong> <strong>Drivers</strong>: <strong>Drug</strong> ResultsTable 87. <strong>Drug</strong> Prevalence <strong>by</strong> Age (Blood)AgeN(Unweighted)% <strong>Drug</strong> Positive(Weighted)16-20 459 20.5%21-34 1,372 15.2%35-44 625 10.7%45-64 697 11.2%65+ 91 6.0%Overall 3,244 14.0%Comparisons between gender within age group (Table 88) showed that drug prevalence amongmale drivers ages 16-20 was significantly higher than female drivers ages 16-20 (p < .01).Further, drug prevalence among male drivers aged 21-34 was also significantly higher than thesame-aged female counterparts (p < .05).Among drivers aged 45-64, however, drug prevalencewas higher in females than in males (p < .01).Table 88. <strong>Drug</strong> Prevalence <strong>by</strong> Age <strong>and</strong> Gender (Blood)GenderMalesFemalesAgeN(Unweighted)% <strong>Drug</strong> Positive(Weighted)16-20 301 22.8%21-34 825 16.9%35-44 368 11.2%45-64 413 8.3%65+ 61 6.0%Overall Males 1,968 14.6%16-20 158 16.5%21-34 547 12.2%35-44 254 10.5%45-64 283 16.7%65+ 30 5.8%Overall Females 1,272 13.0%Comparing drug prevalence between race/ethnicity (Table 89), Asian drivers were significantlyless likely to be drug positive (1.3%) than drivers who identified themselves as AfricanAmerican, Hispanic, White, or Other (p < .01).Table 89. <strong>Drug</strong> Prevalence <strong>by</strong> Race/Ethnicity (Blood)Race/EthnicityN(Unweighted)% <strong>Drug</strong> Positive(Weighted)African American 569 16.8%Asian 87 1.3%Hispanic 585 10.0%White 1,836 15.5%Other 165 19.7%Overall 3,242 14.0%Race/Ethnic groups other than “Hispanic” are always “non-Hispanic.”78

