

2007 National Roadside Survey of Alcohol and Drug Use by Drivers
2007 National Roadside Survey of Alcohol and Drug Use by Drivers
2007 National Roadside Survey of Alcohol and Drug Use by Drivers

Create successful ePaper yourself
Turn your PDF publications into a flip-book with our unique Google optimized e-Paper software.
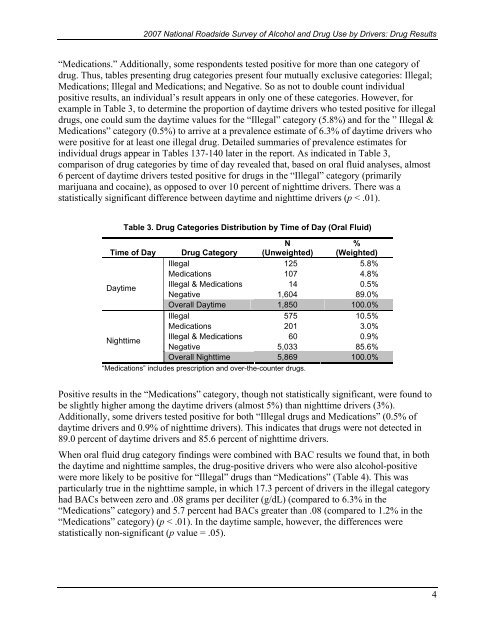
<strong>2007</strong> <strong>National</strong> <strong>Roadside</strong> <strong>Survey</strong> <strong>of</strong> <strong>Alcohol</strong> <strong>and</strong> <strong>Drug</strong> <strong>Use</strong> <strong>by</strong> <strong>Drivers</strong>: <strong>Drug</strong> Results“Medications.” Additionally, some respondents tested positive for more than one category <strong>of</strong>drug. Thus, tables presenting drug categories present four mutually exclusive categories: Illegal;Medications; Illegal <strong>and</strong> Medications; <strong>and</strong> Negative. So as not to double count individualpositive results, an individual’s result appears in only one <strong>of</strong> these categories. However, forexample in Table 3, to determine the proportion <strong>of</strong> daytime drivers who tested positive for illegaldrugs, one could sum the daytime values for the “Illegal” category (5.8%) <strong>and</strong> for the ” Illegal &Medications” category (0.5%) to arrive at a prevalence estimate <strong>of</strong> 6.3% <strong>of</strong> daytime drivers whowere positive for at least one illegal drug. Detailed summaries <strong>of</strong> prevalence estimates forindividual drugs appear in Tables 137-140 later in the report. As indicated in Table 3,comparison <strong>of</strong> drug categories <strong>by</strong> time <strong>of</strong> day revealed that, based on oral fluid analyses, almost6 percent <strong>of</strong> daytime drivers tested positive for drugs in the “Illegal” category (primarilymarijuana <strong>and</strong> cocaine), as opposed to over 10 percent <strong>of</strong> nighttime drivers. There was astatistically significant difference between daytime <strong>and</strong> nighttime drivers (p < .01).Table 3. <strong>Drug</strong> Categories Distribution <strong>by</strong> Time <strong>of</strong> Day (Oral Fluid)Time <strong>of</strong> Day <strong>Drug</strong> CategoryN(Unweighted)%(Weighted)Illegal 125 5.8%Medications 107 4.8%DaytimeIllegal & Medications 14 0.5%Negative 1,604 89.0%Overall Daytime 1,850 100.0%Illegal 575 10.5%Medications 201 3.0%NighttimeIllegal & Medications 60 0.9%Negative 5,033 85.6%Overall Nighttime 5,869 100.0%“Medications” includes prescription <strong>and</strong> over-the-counter drugs.Positive results in the “Medications” category, though not statistically significant, were found tobe slightly higher among the daytime drivers (almost 5%) than nighttime drivers (3%).Additionally, some drivers tested positive for both “Illegal drugs <strong>and</strong> Medications” (0.5% <strong>of</strong>daytime drivers <strong>and</strong> 0.9% <strong>of</strong> nighttime drivers). This indicates that drugs were not detected in89.0 percent <strong>of</strong> daytime drivers <strong>and</strong> 85.6 percent <strong>of</strong> nighttime drivers.When oral fluid drug category findings were combined with BAC results we found that, in boththe daytime <strong>and</strong> nighttime samples, the drug-positive drivers who were also alcohol-positivewere more likely to be positive for “Illegal” drugs than “Medications” (Table 4). This wasparticularly true in the nighttime sample, in which 17.3 percent <strong>of</strong> drivers in the illegal categoryhad BACs between zero <strong>and</strong> .08 grams per deciliter (g/dL) (compared to 6.3% in the“Medications” category) <strong>and</strong> 5.7 percent had BACs greater than .08 (compared to 1.2% in the“Medications” category) (p < .01). In the daytime sample, however, the differences werestatistically non-significant (p value = .05).4

