

2007 National Roadside Survey of Alcohol and Drug Use by Drivers
2007 National Roadside Survey of Alcohol and Drug Use by Drivers
2007 National Roadside Survey of Alcohol and Drug Use by Drivers

Create successful ePaper yourself
Turn your PDF publications into a flip-book with our unique Google optimized e-Paper software.
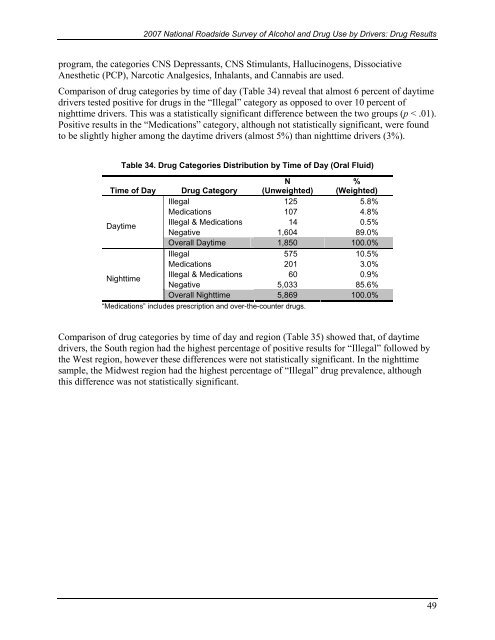
<strong>2007</strong> <strong>National</strong> <strong>Roadside</strong> <strong>Survey</strong> <strong>of</strong> <strong>Alcohol</strong> <strong>and</strong> <strong>Drug</strong> <strong>Use</strong> <strong>by</strong> <strong>Drivers</strong>: <strong>Drug</strong> Resultsprogram, the categories CNS Depressants, CNS Stimulants, Hallucinogens, DissociativeAnesthetic (PCP), Narcotic Analgesics, Inhalants, <strong>and</strong> Cannabis are used.Comparison <strong>of</strong> drug categories <strong>by</strong> time <strong>of</strong> day (Table 34) reveal that almost 6 percent <strong>of</strong> daytimedrivers tested positive for drugs in the “Illegal” category as opposed to over 10 percent <strong>of</strong>nighttime drivers. This was a statistically significant difference between the two groups (p < .01).Positive results in the “Medications” category, although not statistically significant, were foundto be slightly higher among the daytime drivers (almost 5%) than nighttime drivers (3%).Table 34. <strong>Drug</strong> Categories Distribution <strong>by</strong> Time <strong>of</strong> Day (Oral Fluid)Time <strong>of</strong> Day <strong>Drug</strong> CategoryN(Unweighted)%(Weighted)Illegal 125 5.8%Medications 107 4.8%DaytimeIllegal & Medications 14 0.5%Negative 1,604 89.0%Overall Daytime 1,850 100.0%Illegal 575 10.5%Medications 201 3.0%NighttimeIllegal & Medications 60 0.9%Negative 5,033 85.6%Overall Nighttime 5,869 100.0%“Medications” includes prescription <strong>and</strong> over-the-counter drugs.Comparison <strong>of</strong> drug categories <strong>by</strong> time <strong>of</strong> day <strong>and</strong> region (Table 35) showed that, <strong>of</strong> daytimedrivers, the South region had the highest percentage <strong>of</strong> positive results for “Illegal” followed <strong>by</strong>the West region, however these differences were not statistically significant. In the nighttimesample, the Midwest region had the highest percentage <strong>of</strong> “Illegal” drug prevalence, althoughthis difference was not statistically significant.49

