

2007 National Roadside Survey of Alcohol and Drug Use by Drivers
2007 National Roadside Survey of Alcohol and Drug Use by Drivers
2007 National Roadside Survey of Alcohol and Drug Use by Drivers

Create successful ePaper yourself
Turn your PDF publications into a flip-book with our unique Google optimized e-Paper software.
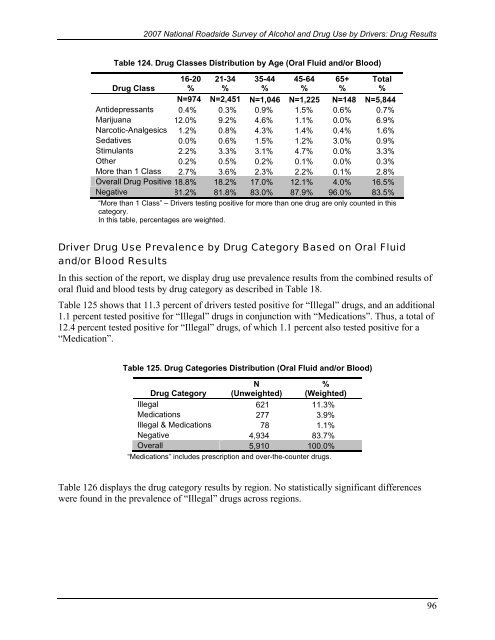
<strong>2007</strong> <strong>National</strong> <strong>Roadside</strong> <strong>Survey</strong> <strong>of</strong> <strong>Alcohol</strong> <strong>and</strong> <strong>Drug</strong> <strong>Use</strong> <strong>by</strong> <strong>Drivers</strong>: <strong>Drug</strong> ResultsTable 124. <strong>Drug</strong> Classes Distribution <strong>by</strong> Age (Oral Fluid <strong>and</strong>/or Blood)<strong>Drug</strong> Class16-20%21-34%35-44%45-64%65+%Total%N=974 N=2,451 N=1,046 N=1,225 N=148 N=5,844Antidepressants 0.4% 0.3% 0.9% 1.5% 0.6% 0.7%Marijuana 12.0% 9.2% 4.6% 1.1% 0.0% 6.9%Narcotic-Analgesics 1.2% 0.8% 4.3% 1.4% 0.4% 1.6%Sedatives 0.0% 0.6% 1.5% 1.2% 3.0% 0.9%Stimulants 2.2% 3.3% 3.1% 4.7% 0.0% 3.3%Other 0.2% 0.5% 0.2% 0.1% 0.0% 0.3%More than 1 Class 2.7% 3.6% 2.3% 2.2% 0.1% 2.8%Overall <strong>Drug</strong> Positive 18.8% 18.2% 17.0% 12.1% 4.0% 16.5%Negative 81.2% 81.8% 83.0% 87.9% 96.0% 83.5%“More than 1 Class” – <strong>Drivers</strong> testing positive for more than one drug are only counted in thiscategory.In this table, percentages are weighted.Driver <strong>Drug</strong> <strong>Use</strong> Prevalence <strong>by</strong> <strong>Drug</strong> Category Based on Oral Fluid<strong>and</strong>/or Blood ResultsIn this section <strong>of</strong> the report, we display drug use prevalence results from the combined results <strong>of</strong>oral fluid <strong>and</strong> blood tests <strong>by</strong> drug category as described in Table 18.Table 125 shows that 11.3 percent <strong>of</strong> drivers tested positive for “Illegal” drugs, <strong>and</strong> an additional1.1 percent tested positive for “Illegal” drugs in conjunction with “Medications”. Thus, a total <strong>of</strong>12.4 percent tested positive for “Illegal” drugs, <strong>of</strong> which 1.1 percent also tested positive for a“Medication”.Table 125. <strong>Drug</strong> Categories Distribution (Oral Fluid <strong>and</strong>/or Blood)<strong>Drug</strong> CategoryN(Unweighted)%(Weighted)Illegal 621 11.3%Medications 277 3.9%Illegal & Medications 78 1.1%Negative 4,934 83.7%Overall 5,910 100.0%“Medications” includes prescription <strong>and</strong> over-the-counter drugs.Table 126 displays the drug category results <strong>by</strong> region. No statistically significant differenceswere found in the prevalence <strong>of</strong> “Illegal” drugs across regions.96

