

2007 National Roadside Survey of Alcohol and Drug Use by Drivers
2007 National Roadside Survey of Alcohol and Drug Use by Drivers
2007 National Roadside Survey of Alcohol and Drug Use by Drivers

Create successful ePaper yourself
Turn your PDF publications into a flip-book with our unique Google optimized e-Paper software.
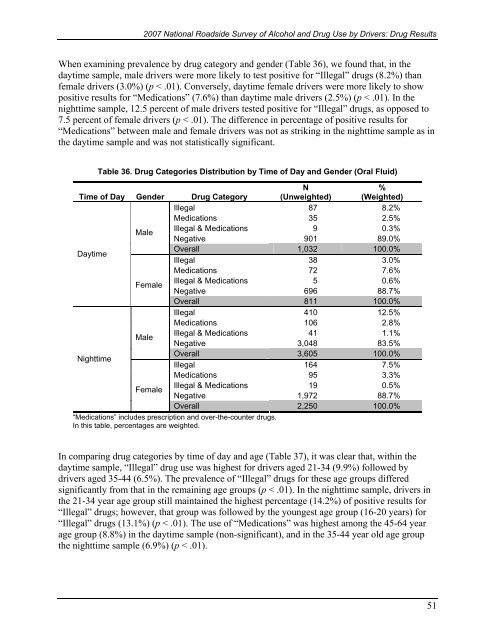
<strong>2007</strong> <strong>National</strong> <strong>Roadside</strong> <strong>Survey</strong> <strong>of</strong> <strong>Alcohol</strong> <strong>and</strong> <strong>Drug</strong> <strong>Use</strong> <strong>by</strong> <strong>Drivers</strong>: <strong>Drug</strong> ResultsWhen examining prevalence <strong>by</strong> drug category <strong>and</strong> gender (Table 36), we found that, in thedaytime sample, male drivers were more likely to test positive for “Illegal” drugs (8.2%) thanfemale drivers (3.0%) (p < .01). Conversely, daytime female drivers were more likely to showpositive results for “Medications” (7.6%) than daytime male drivers (2.5%) (p < .01). In thenighttime sample, 12.5 percent <strong>of</strong> male drivers tested positive for “Illegal” drugs, as opposed to7.5 percent <strong>of</strong> female drivers (p < .01). The difference in percentage <strong>of</strong> positive results for“Medications” between male <strong>and</strong> female drivers was not as striking in the nighttime sample as inthe daytime sample <strong>and</strong> was not statistically significant.Table 36. <strong>Drug</strong> Categories Distribution <strong>by</strong> Time <strong>of</strong> Day <strong>and</strong> Gender (Oral Fluid)Time <strong>of</strong> Day Gender <strong>Drug</strong> CategoryN(Unweighted)%(Weighted)Illegal 87 8.2%Medications 35 2.5%MaleIllegal & Medications 9 0.3%Negative 901 89.0%DaytimeOverall 1,032 100.0%Illegal 38 3.0%Medications 72 7.6%FemaleIllegal & Medications 5 0.6%Negative 696 88.7%Overall 811 100.0%Illegal 410 12.5%Medications 106 2.8%MaleIllegal & Medications 41 1.1%Negative 3,048 83.5%NighttimeOverall 3,605 100.0%Illegal 164 7.5%Medications 95 3.3%FemaleIllegal & Medications 19 0.5%Negative 1,972 88.7%Overall 2,250 100.0%“Medications” includes prescription <strong>and</strong> over-the-counter drugs.In this table, percentages are weighted.In comparing drug categories <strong>by</strong> time <strong>of</strong> day <strong>and</strong> age (Table 37), it was clear that, within thedaytime sample, “Illegal” drug use was highest for drivers aged 21-34 (9.9%) followed <strong>by</strong>drivers aged 35-44 (6.5%). The prevalence <strong>of</strong> “Illegal” drugs for these age groups differedsignificantly from that in the remaining age groups (p < .01). In the nighttime sample, drivers inthe 21-34 year age group still maintained the highest percentage (14.2%) <strong>of</strong> positive results for“Illegal” drugs; however, that group was followed <strong>by</strong> the youngest age group (16-20 years) for“Illegal” drugs (13.1%) (p < .01). The use <strong>of</strong> “Medications” was highest among the 45-64 yearage group (8.8%) in the daytime sample (non-significant), <strong>and</strong> in the 35-44 year old age groupthe nighttime sample (6.9%) (p < .01).51

