2007 National Roadside Survey of Alcohol and Drug Use by Drivers
2007 National Roadside Survey of Alcohol and Drug Use by Drivers
2007 National Roadside Survey of Alcohol and Drug Use by Drivers
Create successful ePaper yourself
Turn your PDF publications into a flip-book with our unique Google optimized e-Paper software.
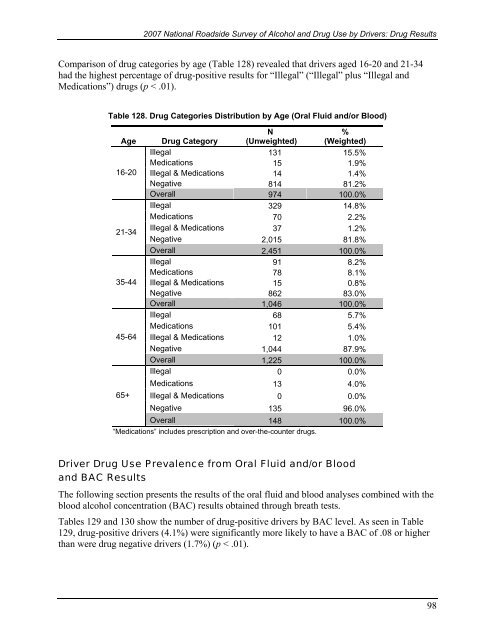
<strong>2007</strong> <strong>National</strong> <strong>Roadside</strong> <strong>Survey</strong> <strong>of</strong> <strong>Alcohol</strong> <strong>and</strong> <strong>Drug</strong> <strong>Use</strong> <strong>by</strong> <strong>Drivers</strong>: <strong>Drug</strong> ResultsComparison <strong>of</strong> drug categories <strong>by</strong> age (Table 128) revealed that drivers aged 16-20 <strong>and</strong> 21-34had the highest percentage <strong>of</strong> drug-positive results for “Illegal” (“Illegal” plus “Illegal <strong>and</strong>Medications”) drugs (p < .01).Table 128. <strong>Drug</strong> Categories Distribution <strong>by</strong> Age (Oral Fluid <strong>and</strong>/or Blood)Age <strong>Drug</strong> CategoryN(Unweighted)%(Weighted)Illegal 131 15.5%Medications 15 1.9%16-20 Illegal & Medications 14 1.4%Negative 814 81.2%Overall 974 100.0%Illegal 329 14.8%Medications 70 2.2%Illegal & Medications21-3437 1.2%Negative 2,015 81.8%Overall 2,451 100.0%Illegal 91 8.2%Medications 78 8.1%35-44 Illegal & Medications 15 0.8%Negative 862 83.0%Overall 1,046 100.0%Illegal 68 5.7%Medications 101 5.4%45-64 Illegal & Medications 12 1.0%Negative 1,044 87.9%Overall 1,225 100.0%Illegal 0 0.0%Medications 13 4.0%65+ Illegal & Medications 0 0.0%Negative 135 96.0%Overall 148 100.0%“Medications” includes prescription <strong>and</strong> over-the-counter drugs.Driver <strong>Drug</strong> <strong>Use</strong> Prevalence from Oral Fluid <strong>and</strong>/or Blood<strong>and</strong> BAC ResultsThe following section presents the results <strong>of</strong> the oral fluid <strong>and</strong> blood analyses combined with theblood alcohol concentration (BAC) results obtained through breath tests.Tables 129 <strong>and</strong> 130 show the number <strong>of</strong> drug-positive drivers <strong>by</strong> BAC level. As seen in Table129, drug-positive drivers (4.1%) were significantly more likely to have a BAC <strong>of</strong> .08 or higherthan were drug negative drivers (1.7%) (p < .01).98


